Fig. 1.
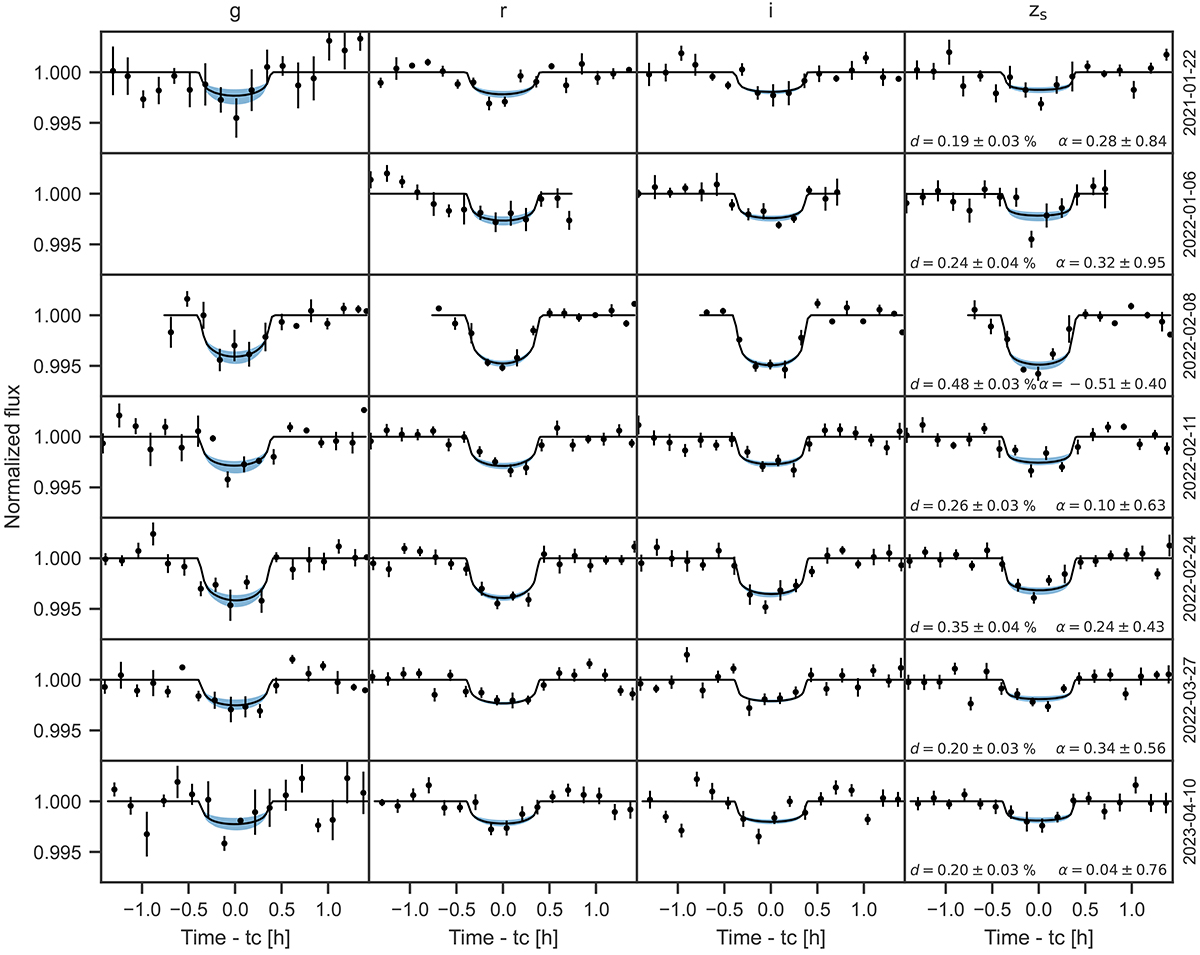
Download original image
MuSCAT3 and MuSCAT2 photometry of seven K2-22b transits (UT dates at right) binned to 10-min intervals for visualisation (black points), along with the median of the posterior model fits (black line) and 16th and 84th percentiles (blue shading). The posteriors of the reference band transit depth k0 = Rp/R* and Ångström coefficient α estimates are reported in the rightmost panels.
Current usage metrics show cumulative count of Article Views (full-text article views including HTML views, PDF and ePub downloads, according to the available data) and Abstracts Views on Vision4Press platform.
Data correspond to usage on the plateform after 2015. The current usage metrics is available 48-96 hours after online publication and is updated daily on week days.
Initial download of the metrics may take a while.