Fig. 4.
Download original image
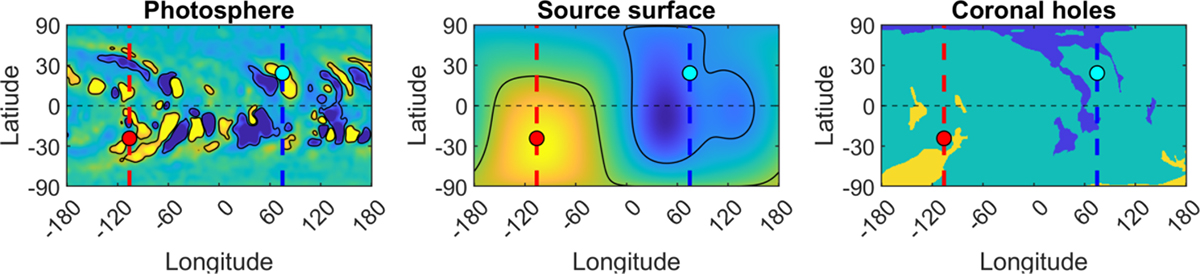
KP synoptic maps for Carrington rotation 1999. Left column: Photospheric magnetic field. The magnetogram was smoothed with a Gaussian smoothing kernel with a standard deviation of 3. The black lines correspond to B = ± 10 G contours. Center column: KP PFSS source surface magnetic field. The black lines correspond to B = ± 0.15 G contours. Right column: Coronal holes from the McIntosh archive. Yellow and blue correspond to positive and negative polarity in all maps. The dashed red and blue lines mark the vector sum longitude and its opposite. The red and cyan circles mark the vector sum direction and its antipode.
Current usage metrics show cumulative count of Article Views (full-text article views including HTML views, PDF and ePub downloads, according to the available data) and Abstracts Views on Vision4Press platform.
Data correspond to usage on the plateform after 2015. The current usage metrics is available 48-96 hours after online publication and is updated daily on week days.
Initial download of the metrics may take a while.