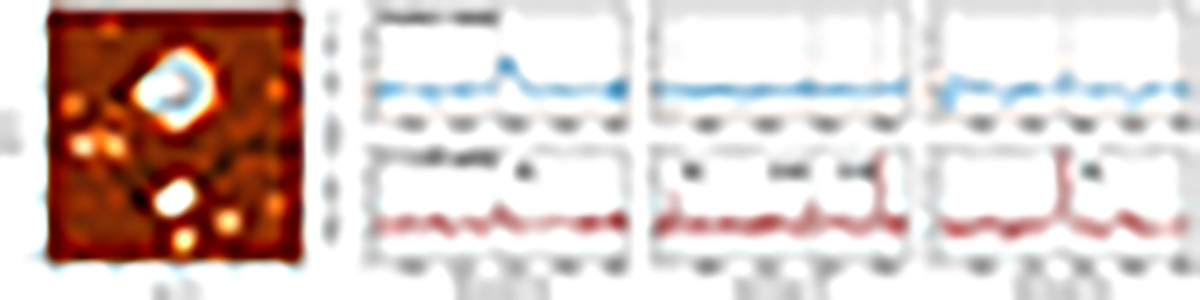
Fig. 2.
Download original image
Spectra of the southern extension of the nebula and a close low-redshift interloper. Left-most panel: White-light image of the MUSE data cube around the quasar (at (0, 0) position) prior to subtracting contamination sources. 5 and 10σ contours of the extended Lyα nebula are overlaid. Enclosed by a dashed elliptical contour is the zgal = 0.187 line-emitting galaxy. Other panels: Spectra of the southern portion of the nebula (top row) and the line-emitting galaxy (bottom row) shown in three different wavelength portions covering Hα, Hβ+[O III] and Hγ at zgal, the last of which coincides with Lyα at zquasar = 3.24.
Current usage metrics show cumulative count of Article Views (full-text article views including HTML views, PDF and ePub downloads, according to the available data) and Abstracts Views on Vision4Press platform.
Data correspond to usage on the plateform after 2015. The current usage metrics is available 48-96 hours after online publication and is updated daily on week days.
Initial download of the metrics may take a while.