Open Access
Fig. B.8.
Download original image
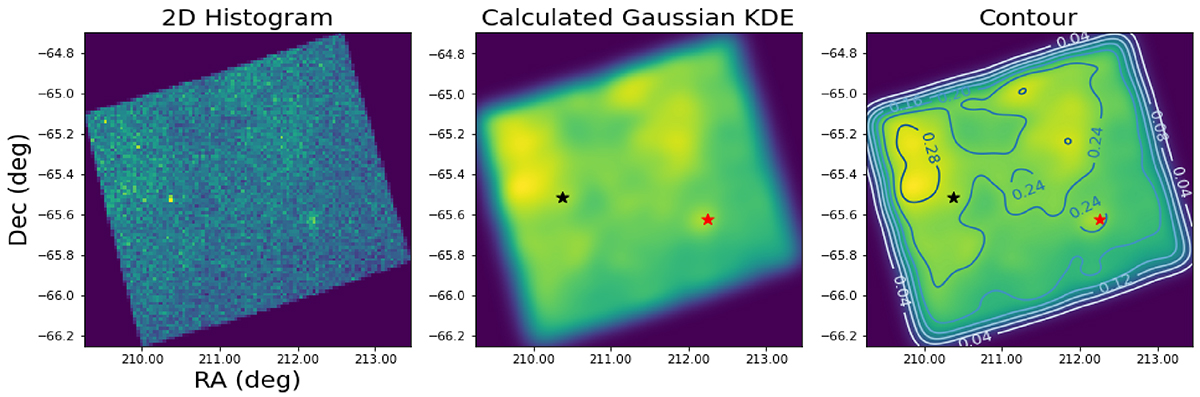
Spatial distribution of the entire tile e0656, where Garro 01 (red star symbol) and Garro 03 (black star symbol) are located. We apply the KDE technique as done in Fig. B.3 with the main intention of detecting (if present) signatures indicating a bridge or streams between the two clusters.
Current usage metrics show cumulative count of Article Views (full-text article views including HTML views, PDF and ePub downloads, according to the available data) and Abstracts Views on Vision4Press platform.
Data correspond to usage on the plateform after 2015. The current usage metrics is available 48-96 hours after online publication and is updated daily on week days.
Initial download of the metrics may take a while.