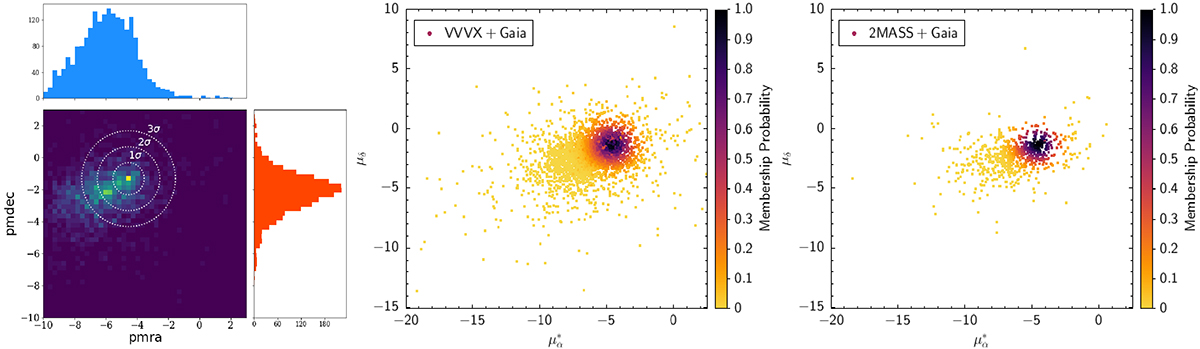
Fig. B.4.
Download original image
VPM diagrams. Left panel: VPM diagram for Garro 03 cluster as a 2D histogram, displaying both the PMRA (in blue) and PMDEC (in red) histograms separately. The yellow and light green colours depict overdensities, whereas the dark green and blue colours represent lower densities. We indicate with dotted white circles the 1σ, 2σ, and 3σ centred on the mean cluster PMs. Middle and right panels: VPM diagrams for the Gaia+VVVX and Gaia+2MASS samples, respectively. The differences in colours reproduce the PM membership probability, as depicted in the colour-bar.
Current usage metrics show cumulative count of Article Views (full-text article views including HTML views, PDF and ePub downloads, according to the available data) and Abstracts Views on Vision4Press platform.
Data correspond to usage on the plateform after 2015. The current usage metrics is available 48-96 hours after online publication and is updated daily on week days.
Initial download of the metrics may take a while.