Fig. B.3.
Download original image
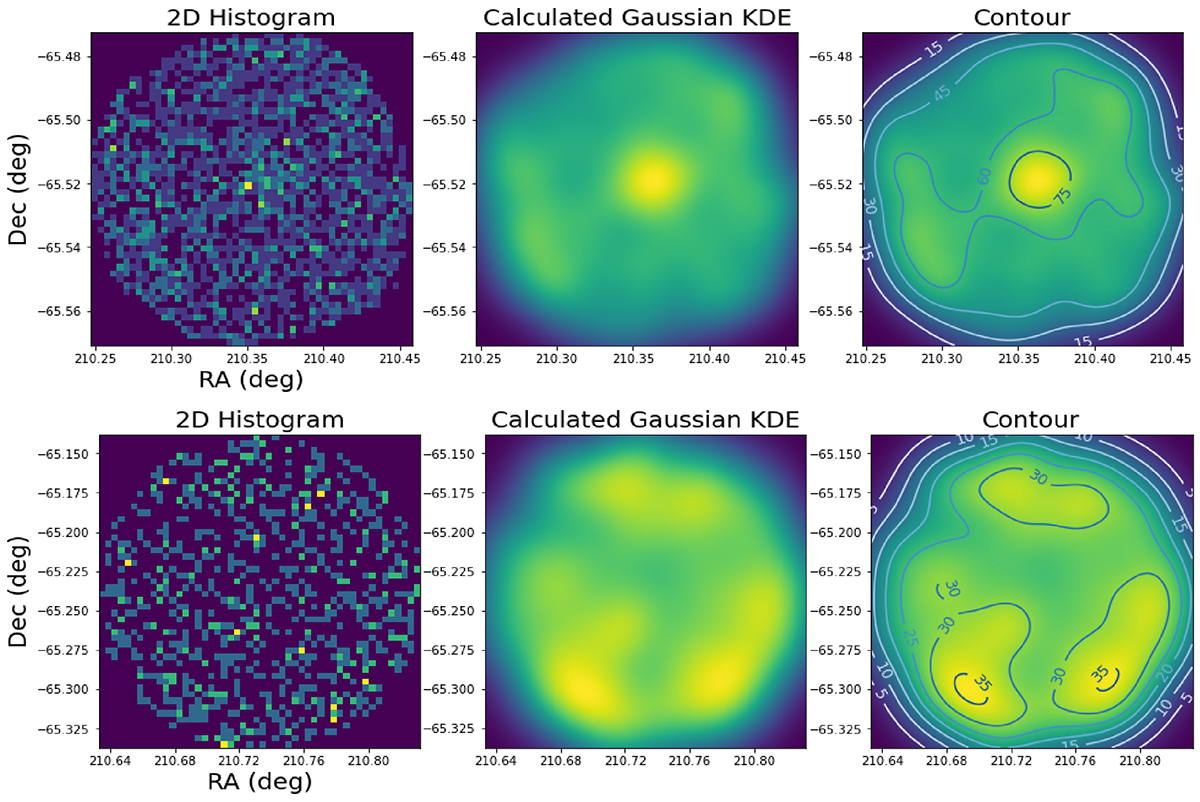
KDE spatial distribution. Top panels: Spatial distribution for Garro 03 selected at r ≲ 3′ from the cluster centre, where we can clearly see a circular overdensity of stars at the cluster position. Bottom panels: Spatial distribution of a 3′ field, selected away from the cluster field, for which no central overdensity is visible. For both cases, the samples used VVVX data, cleaned by nearby stars. These panels show the following from left to right: the 2D histogram and the calculated Gaussian KDE on which we overplotted iso-density contours.
Current usage metrics show cumulative count of Article Views (full-text article views including HTML views, PDF and ePub downloads, according to the available data) and Abstracts Views on Vision4Press platform.
Data correspond to usage on the plateform after 2015. The current usage metrics is available 48-96 hours after online publication and is updated daily on week days.
Initial download of the metrics may take a while.