Fig. B.1.
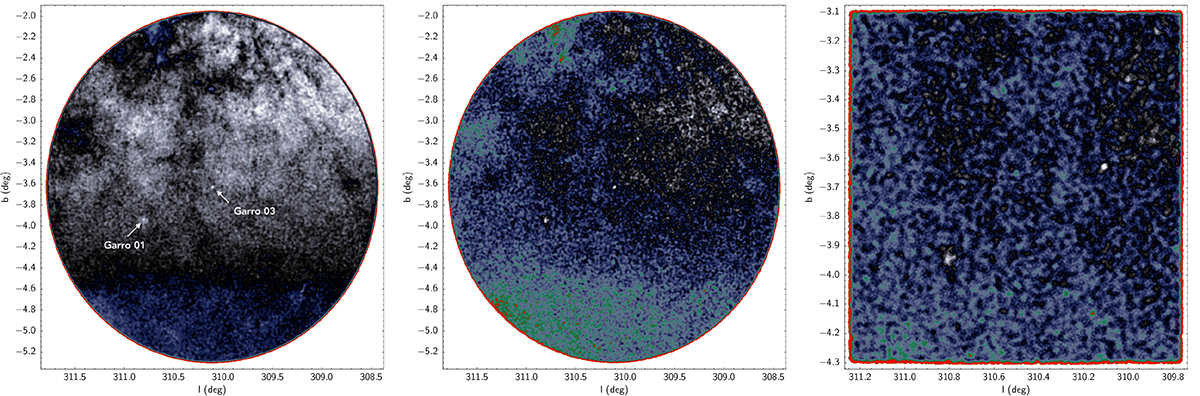
Download original image
Gaia DR3 stellar density map for a r = 100′ field in the Galactic coordinates, centred on Garro 03 target. On the left panel, we draw two arrows to indicate the location of two overdensities, named Garro 01 and Garro 03. In this case, we did not make any cuts. In the middle panel, we make the cuts: plx < 0.5, ruwe < 1.4, -6.0 < pmra < -2.0 mas yr−1, -2.0 < pmdec < 0 mas yr−1, in order to clean the density map and to better highlight the two overdensities. The right panel shows a zoomed-in view, and we used a combination of Gaia DR3+VVVX data. For all panels, the density’s colours increase from the black (lower density) to white (higher density).
Current usage metrics show cumulative count of Article Views (full-text article views including HTML views, PDF and ePub downloads, according to the available data) and Abstracts Views on Vision4Press platform.
Data correspond to usage on the plateform after 2015. The current usage metrics is available 48-96 hours after online publication and is updated daily on week days.
Initial download of the metrics may take a while.