Fig. 4.
Download original image
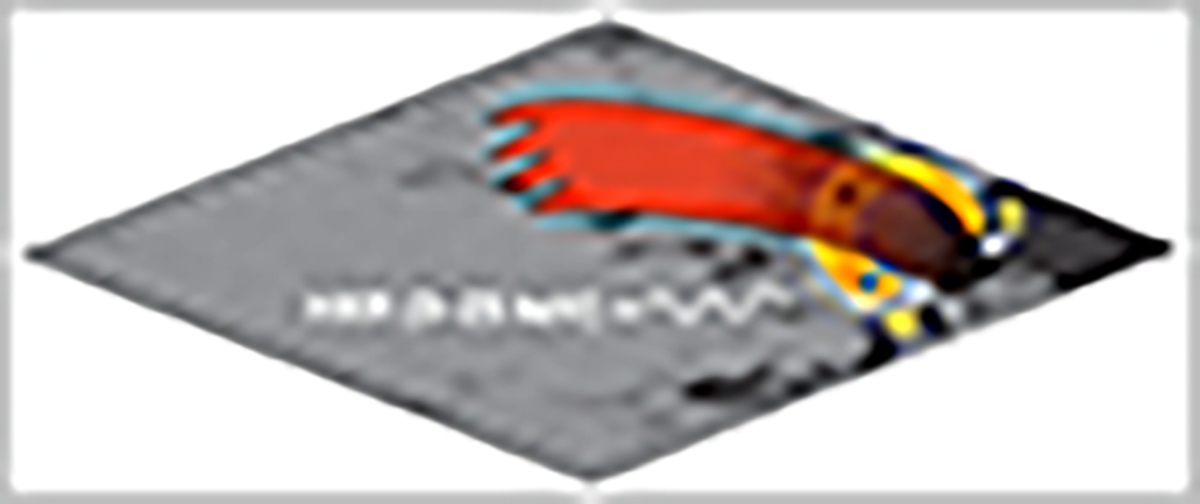
Possible scenarios for the hybrid phenomenon. The background grayscale image is the observed HMI magnetogram (same as in Fig. 1b), the yellow shaded region is the UV burst loop feature rooted at footpoints W and E, and the red shaded structure is the overlying chromospheric canopy. RHESSI detected HXR emission in the 3–25 keV range at footpoint W (see Fig. 1). The stars indicate the location of the magnetic energy release (blue: energy release at footpoint W; black: energy release at the loop-top cusp; see Sect. 6 for a discussion).
Current usage metrics show cumulative count of Article Views (full-text article views including HTML views, PDF and ePub downloads, according to the available data) and Abstracts Views on Vision4Press platform.
Data correspond to usage on the plateform after 2015. The current usage metrics is available 48-96 hours after online publication and is updated daily on week days.
Initial download of the metrics may take a while.