Fig. 3.
Download original image
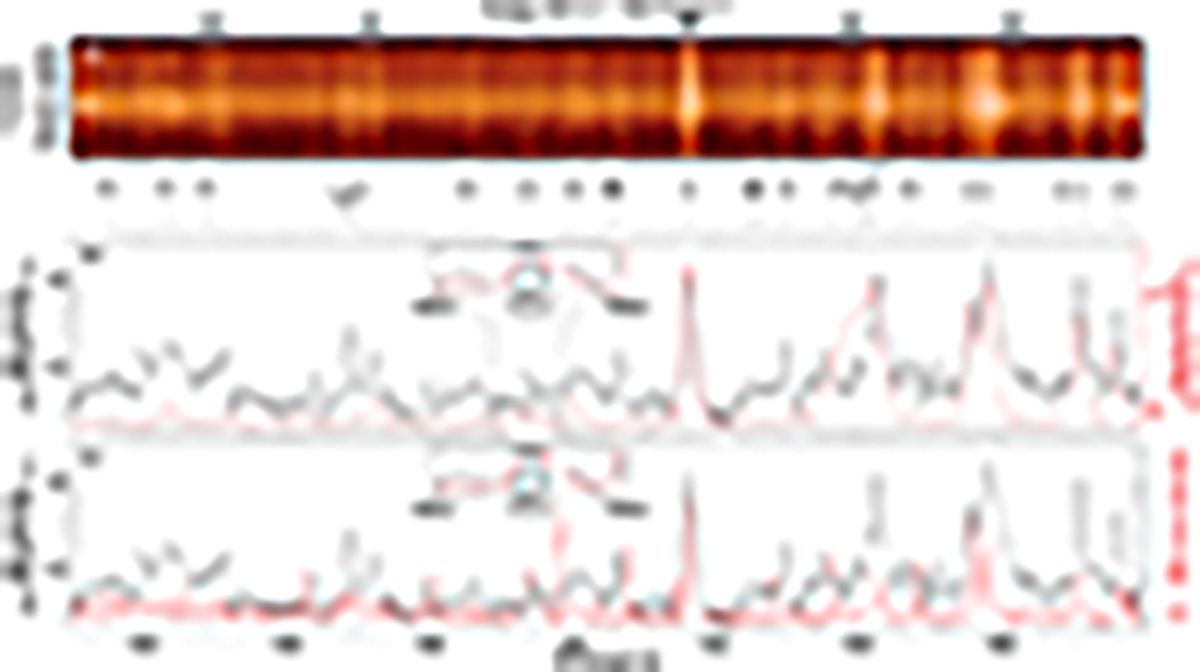
Unusual spectral characteristics. Panel a displays the IRIS detector image. The intensity is plotted on a log-scale along the solar Y-axis that cuts through the cyan diamond in Fig. 1g. The black spectrum in panels b–c is the IRIS intensity obtained from the pixel marked by a pair of white whiskers in the upper panel (the same as the location of the cyan diamond pixel in Fig. 1g). The red spectrum in panel b is the intensity of a flare observed by Skylab. We applied a constant +70 mÅ offset to the original Skylab wavelength array to match the positions of prominent IRIS spectral lines in the plotted wavelength range. In the inset, we zoom into the wavelengths around 1349.4 Å (nominal rest wavelength of Fe XII) and compare the spectra from the IRIS hybrid event and the Skylab flare. The width of the gray shaded bar represents the expected thermal full width at half maximum of the Fe XII emission line (0.152 Å; including the IRIS instrumental width of 26 mÅ). The red curve in panel c is an average spectrum from a moss region (multiplied by 12) that was observed by IRIS in the same data set. In the inset, we compare the spectra from the IRIS hybrid event and the moss region around 1349.4 Å. The labels of some of the known spectral species in the plotted wavelength range are added for reference. The line list was retrieved from the iris_chianti_lookup_table that is available in the IRIS database and Sandlin et al. (1986) (see Sects. 2 and 5 for details).
Current usage metrics show cumulative count of Article Views (full-text article views including HTML views, PDF and ePub downloads, according to the available data) and Abstracts Views on Vision4Press platform.
Data correspond to usage on the plateform after 2015. The current usage metrics is available 48-96 hours after online publication and is updated daily on week days.
Initial download of the metrics may take a while.