Fig. 2.

Download original image
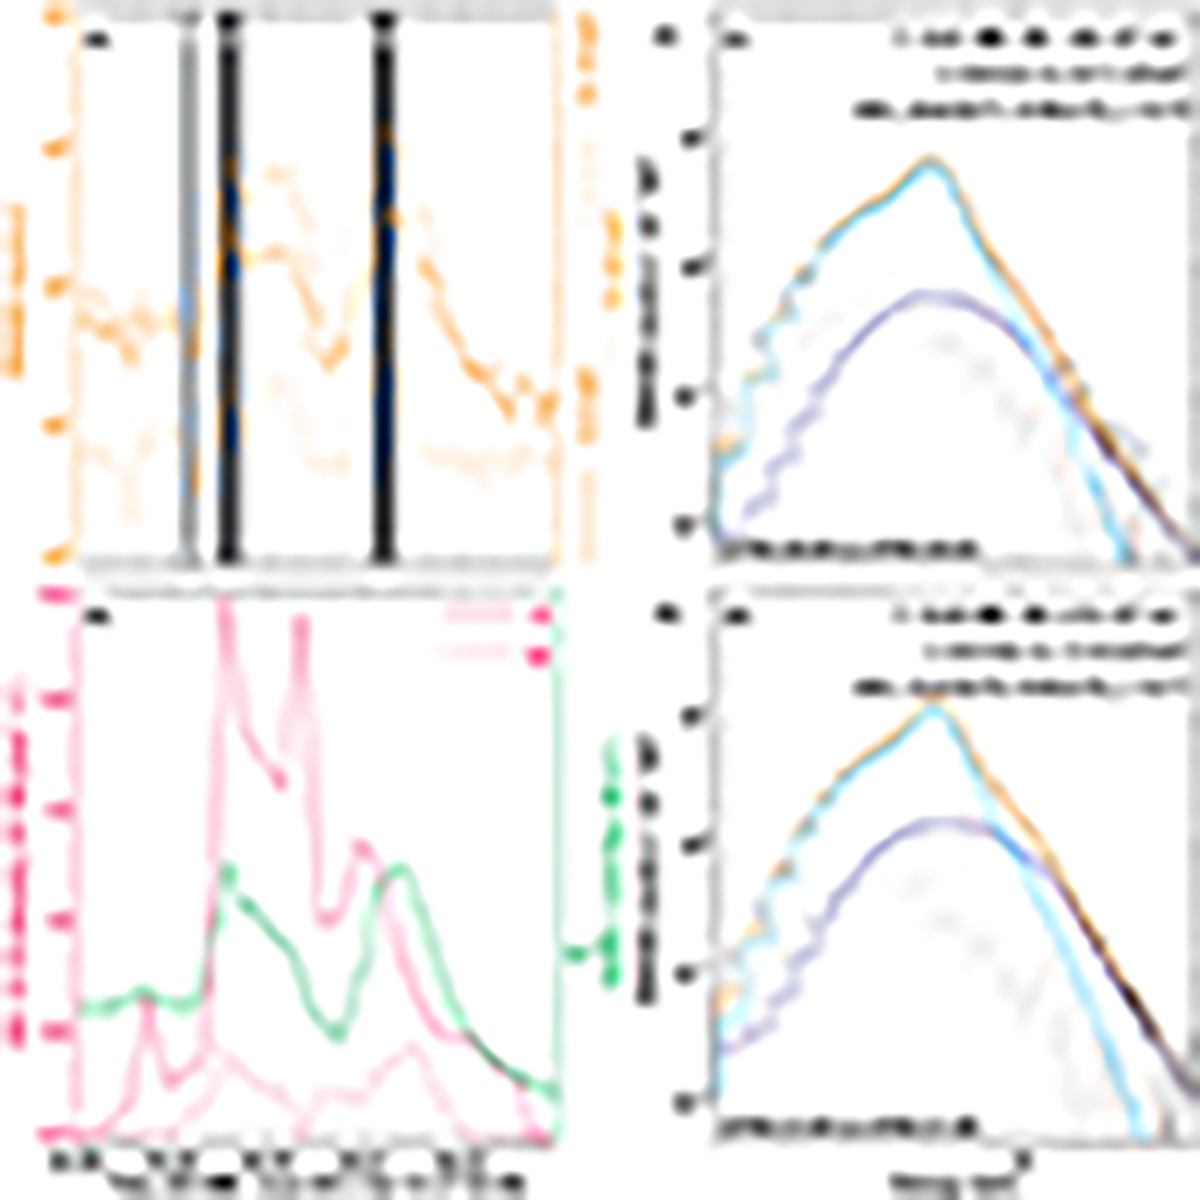
Temporal and thermal evolution. In panel a we plot the time series of RHESSI HXR count rates in three energy windows. The gray bars identify the background (B) and two peaks (P1 and P2) in the RHESSI time series. The disk-integrated GOES soft X-ray time series (green) and cotemporal AIA EUV 131 Å filter light curves of footpoints E and W (pink; see Fig. 1i) are plotted in panel b. Panel c shows the RHESSI energy spectrum as dark gray points of peak P1, binned over the time period defined by the width of the corresponding darker gray bar in panel a. The lighter gray points are the background energy spectrum binned over the time period defined by the lighter gray bar B in panel a. Fits to the spectrum are shown (cyan: thermal; blue: thick2; orange: total). The resulting temperature (T), emission measure (EM), electron spectral index (δ), energy cutoff (Ec), parameters of the pseudo-function (drm_mod), and goodness of the fit (χ2) are listed. Panel d is same as panel c, but plotted for the RHESSI peak P2 from panel a (see Sects. 2 and 4 for details).
Current usage metrics show cumulative count of Article Views (full-text article views including HTML views, PDF and ePub downloads, according to the available data) and Abstracts Views on Vision4Press platform.
Data correspond to usage on the plateform after 2015. The current usage metrics is available 48-96 hours after online publication and is updated daily on week days.
Initial download of the metrics may take a while.


