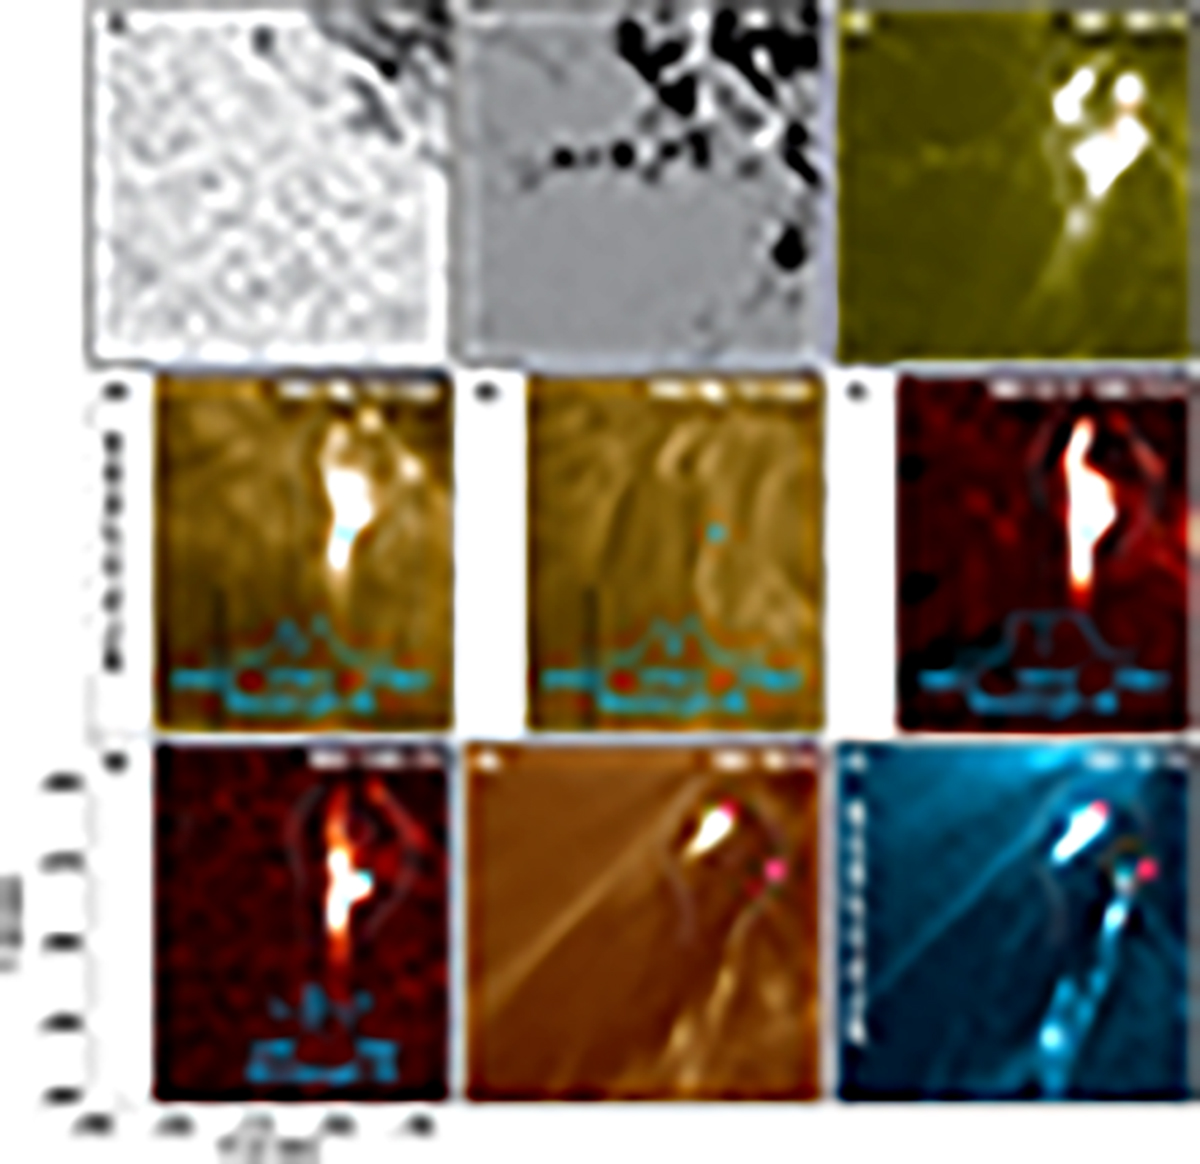
Fig. 1.
Download original image
Multiwavelength overview of SOL2013-10-12T00:30. Panels (a) and (b) show maps of photospheric continuum intensity and line-of-sight magnetic flux density (saturated at ±250 G) observed with SDO/HMI. Ultraviolet diagnostics of the event through the chromosphere and transition region are displayed (these include the AIA 1600 Å map in panel c and raster scans of various spectral lines observed with IRIS in panels d–g). The wavelength position of each raster map in panels d to g is identified with a vertical cyan line that is overlaid on the spectral line profile. In panels d–g, the spectral line profile is obtained from the pixel centered at the cyan diamond (IRIS pixel coordinates x = 67; y = 565). The cyan circle in panel g identifies another spatial location of the brightening (IRIS pixel coordinates x = 75; y = 584). The detector images obtained from the centers of the diamond and circles are further plotted in Figs. 3 and A.1. The time stamp of IRIS spectral line profiles is noted in panel d. Panels h and i are AIA 193 Å and 131 Å filter maps covering the event. Its two footpoints, E and W, are marked. The curved white lines in panels b–d and f–i outline the cusp-shaped morphology of the event. The contours of RHESSI intensities, integrated between UT 00:31:00 and UT 00:31:29, from two energy bands are overlaid in orange in panels c and i (larger outer contour: 5–8 keV; smaller inner contours: 11–18 keV). The contours levels are at 0.3 times the peak intensity of the respective energy band. North is up (see Sects. 2 and 3 for details). An animation of panels h and i without contours is available online.
Current usage metrics show cumulative count of Article Views (full-text article views including HTML views, PDF and ePub downloads, according to the available data) and Abstracts Views on Vision4Press platform.
Data correspond to usage on the plateform after 2015. The current usage metrics is available 48-96 hours after online publication and is updated daily on week days.
Initial download of the metrics may take a while.