Fig. 9
Download original image
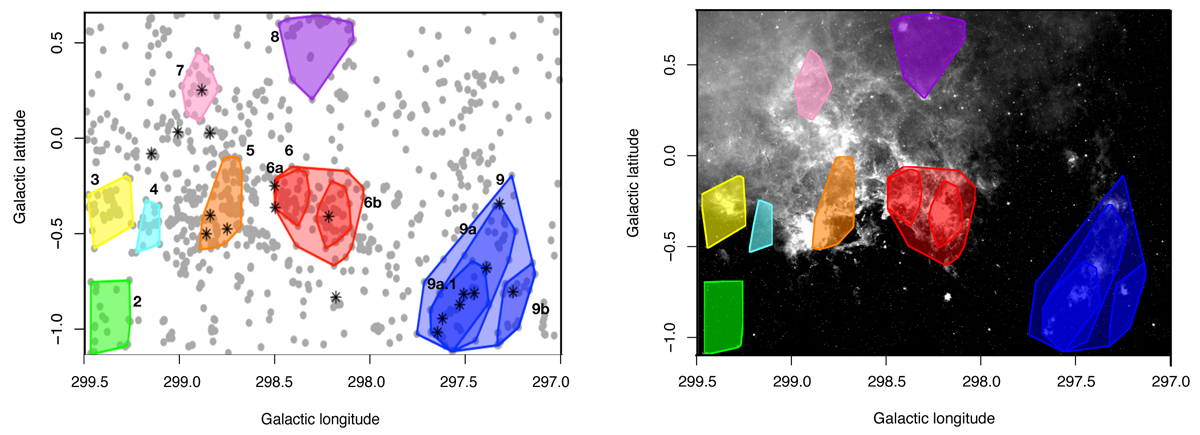
Retrieved clustered structures and substructures in the sample. Left panel: YSOs (grey dots) and convex hulls of the structures, labelled and coloured as in Fig 8. The black asterisks are candidate or confirmed star clusters taken from Table 7 in de la Fuente et al. (2016). Right panel: overlap of the convex hulls of structures and the 8 μm emission map from Spitzer IRAC.
Current usage metrics show cumulative count of Article Views (full-text article views including HTML views, PDF and ePub downloads, according to the available data) and Abstracts Views on Vision4Press platform.
Data correspond to usage on the plateform after 2015. The current usage metrics is available 48-96 hours after online publication and is updated daily on week days.
Initial download of the metrics may take a while.