Open Access
Fig. 7
Download original image
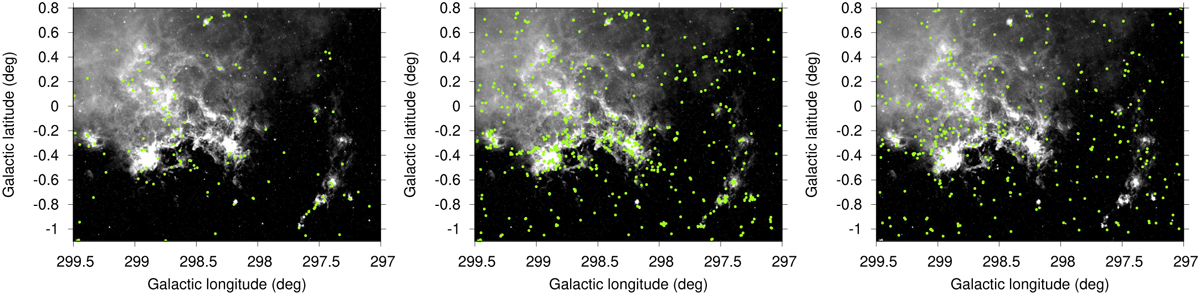
Spatial distribution of YSO candidates selected according to Koenig & Leisawitz (2014)’s criteria overlaid on the 8 μm band map from Spitzer IRAC. The green dots are sources that fulfil criteria of Class I (left panel), Class II (center panel), or transition disk (right panel) objects.
Current usage metrics show cumulative count of Article Views (full-text article views including HTML views, PDF and ePub downloads, according to the available data) and Abstracts Views on Vision4Press platform.
Data correspond to usage on the plateform after 2015. The current usage metrics is available 48-96 hours after online publication and is updated daily on week days.
Initial download of the metrics may take a while.