Fig. 6
Download original image
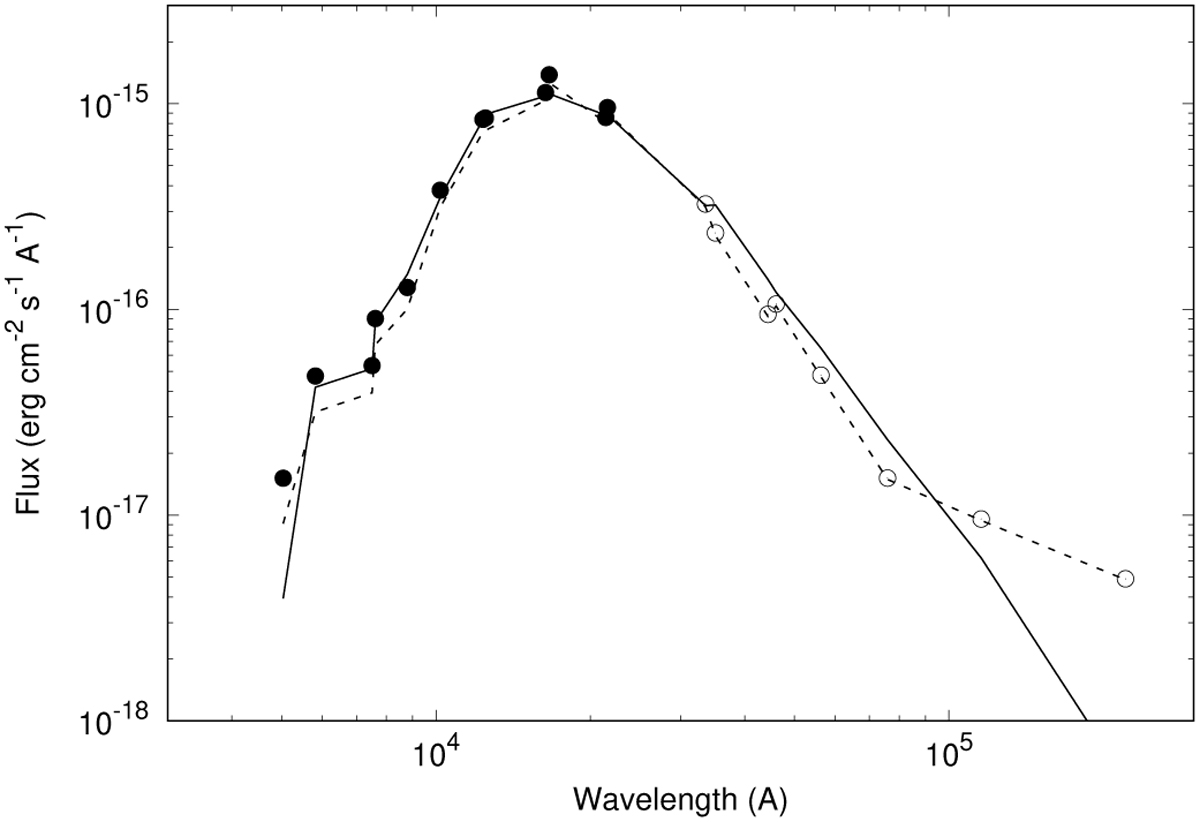
Observed and best-fitted flux densities for one example source, J120022.63-631523.2, for which we obtained Teff = 1700 K and AV = 0.5, which is a transition disk object according to Koenig & Leisawitz (2014)’s criteria. The dashed line indicates the observed photometric data. Circles represent dereddened data, where solid circles denote data points that have been considered in the fitting process by VOSA. The solid lines indicate the best-fitted BT-Settl model. Some infrared excess is evident at wavelengths larger than ~10 μm.
Current usage metrics show cumulative count of Article Views (full-text article views including HTML views, PDF and ePub downloads, according to the available data) and Abstracts Views on Vision4Press platform.
Data correspond to usage on the plateform after 2015. The current usage metrics is available 48-96 hours after online publication and is updated daily on week days.
Initial download of the metrics may take a while.