Fig. 4
Download original image
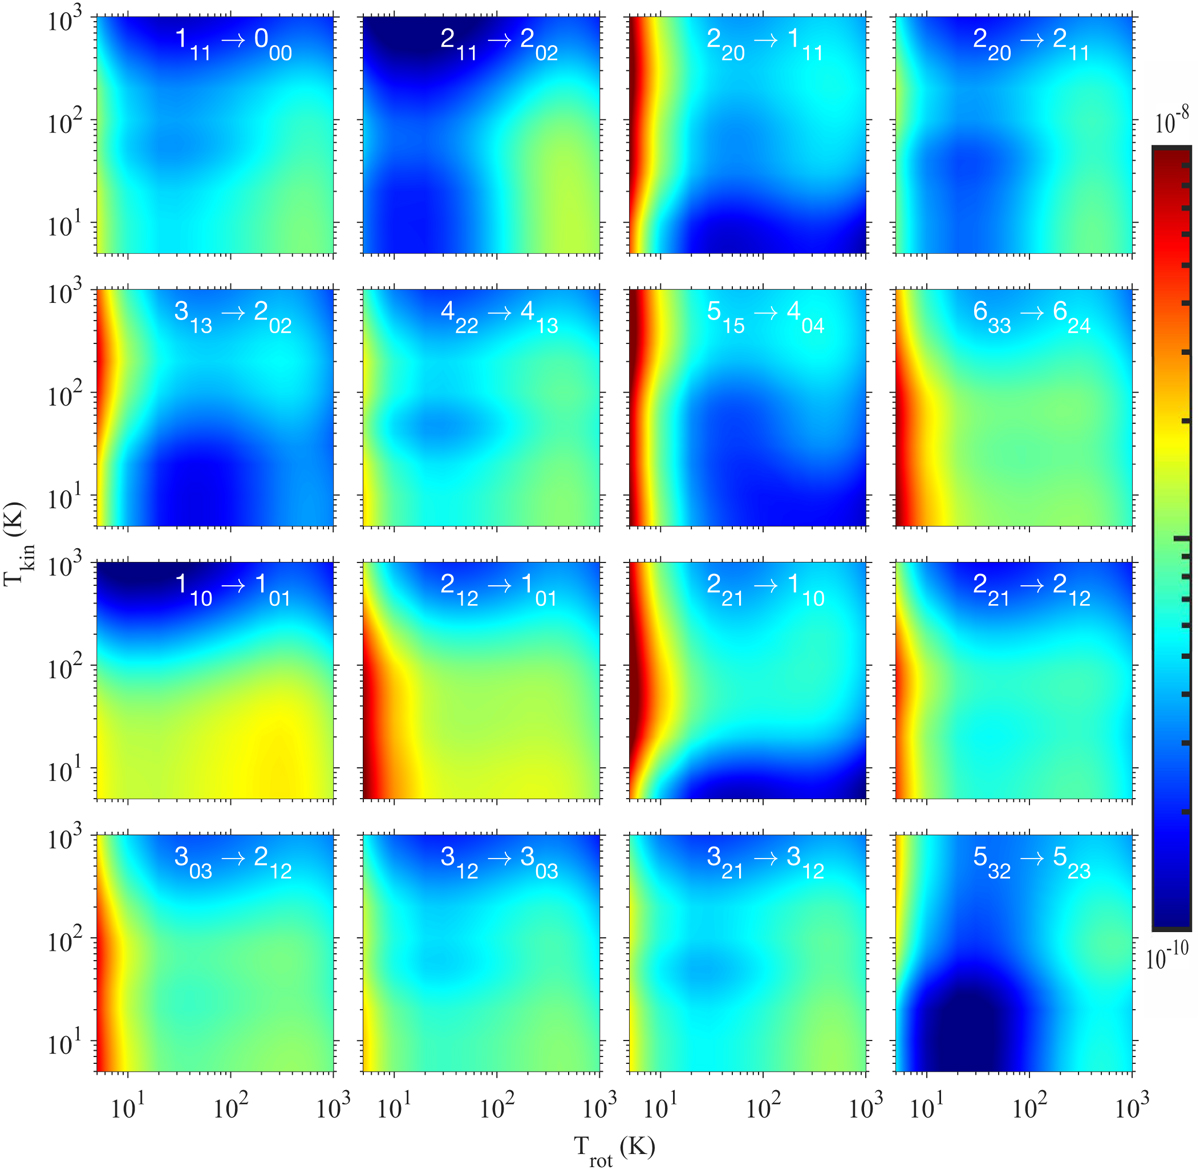
2D dependence of the nonequilibrium rate coefficients for 16 strong transitions in the H2O + H2O system, as indicated in the figure. The rotational and kinetic temperatures are plotted along the horizontal and vertical axis, respectively. Color is used to show the magnitude of rate coefficients in units of cm3 s−1 in log scale as indicated in the color bar.
Current usage metrics show cumulative count of Article Views (full-text article views including HTML views, PDF and ePub downloads, according to the available data) and Abstracts Views on Vision4Press platform.
Data correspond to usage on the plateform after 2015. The current usage metrics is available 48-96 hours after online publication and is updated daily on week days.
Initial download of the metrics may take a while.