Open Access
Fig. 4
Download original image
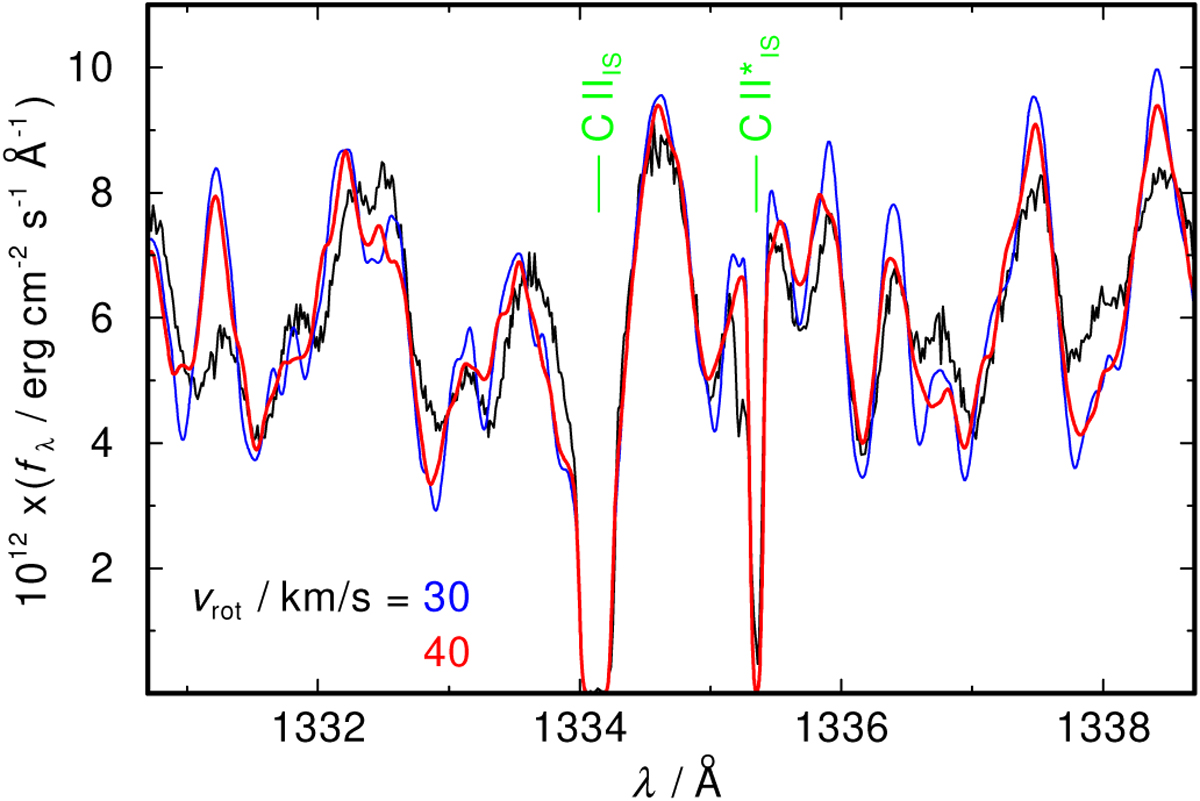
Section of the EC 11481–2303 spectrum (STIS observation in gray, synthetic spectra in red and blue) for determination of vrot. Interstellar C II lines are indicated (index “IS”) and can be clearly distinguished due to the lack of rotational broadening.
Current usage metrics show cumulative count of Article Views (full-text article views including HTML views, PDF and ePub downloads, according to the available data) and Abstracts Views on Vision4Press platform.
Data correspond to usage on the plateform after 2015. The current usage metrics is available 48-96 hours after online publication and is updated daily on week days.
Initial download of the metrics may take a while.