Open Access
Fig. 3
Download original image
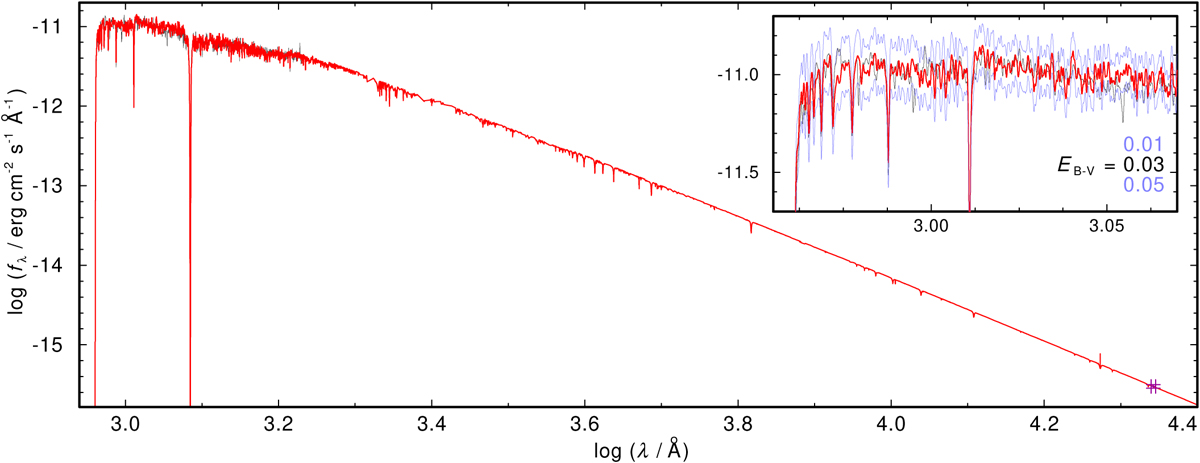
EB–V determination for EC 11481–2303. The model flux (red) is normalized to the 2MASS Ks brightness (purple mark, bottom right). The FUSE observation is shown in gray. The insert (top right) shows a detail of the FUSE observation around 1000 A, compared to our synthetic flux attenuated with three different EB–V values.
Current usage metrics show cumulative count of Article Views (full-text article views including HTML views, PDF and ePub downloads, according to the available data) and Abstracts Views on Vision4Press platform.
Data correspond to usage on the plateform after 2015. The current usage metrics is available 48-96 hours after online publication and is updated daily on week days.
Initial download of the metrics may take a while.