Open Access
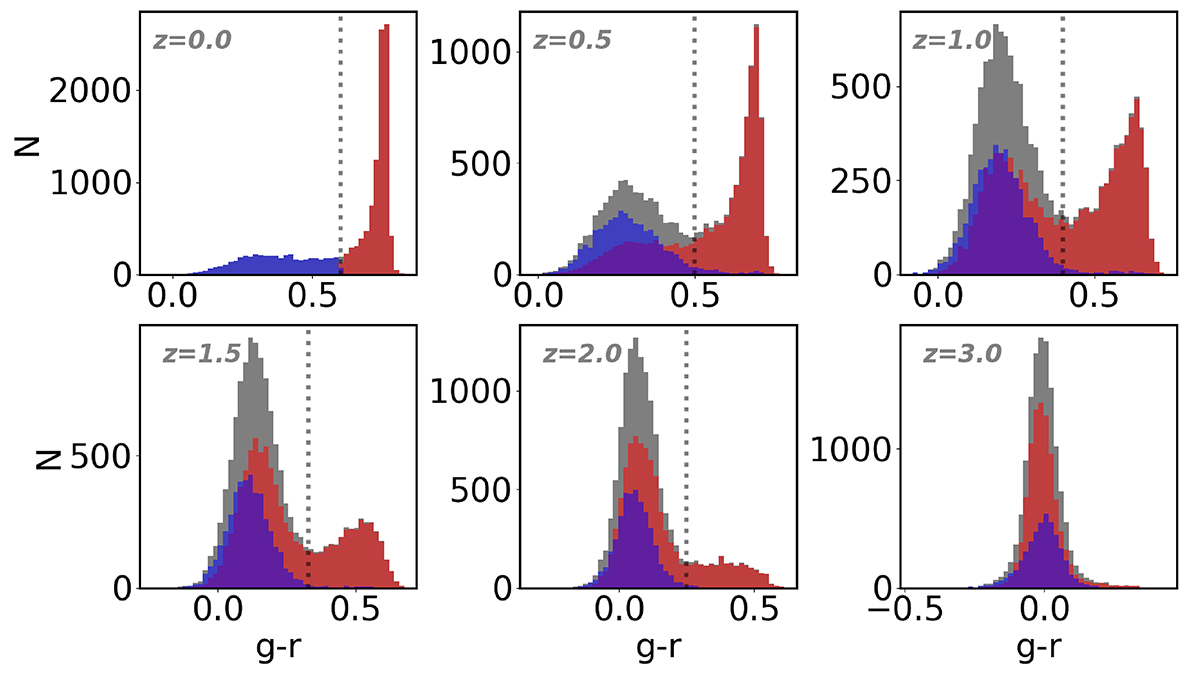
Fig. 3.
Download original image
Evolution of the colour of galaxies. The total sample is shown in grey, while the galaxies that were red and blue at z = 0 are shown in those respective colours. The vertical dotted lines represent the colour cut-off corresponding to each redshift.
Current usage metrics show cumulative count of Article Views (full-text article views including HTML views, PDF and ePub downloads, according to the available data) and Abstracts Views on Vision4Press platform.
Data correspond to usage on the plateform after 2015. The current usage metrics is available 48-96 hours after online publication and is updated daily on week days.
Initial download of the metrics may take a while.