Open Access
Fig. B.2.
Download original image
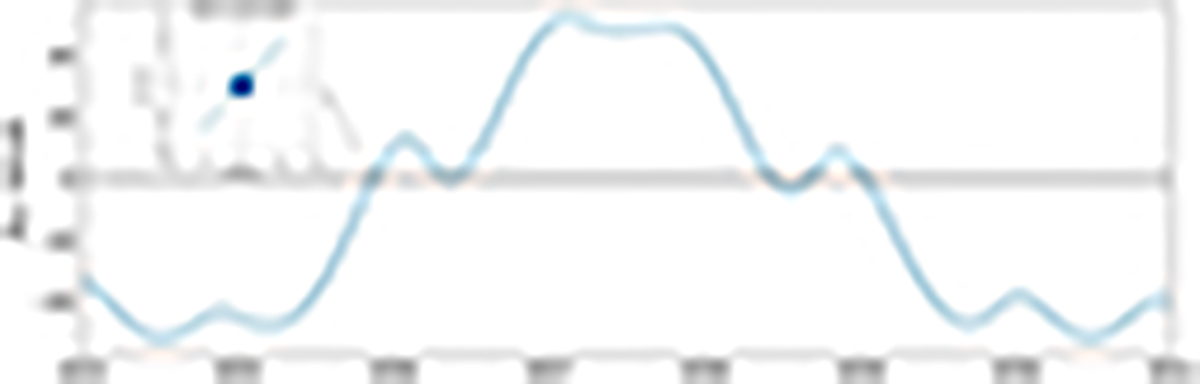
Prediction of the Earth’s elevation (sub-Earth point latitude βSEP) above the orbital plane. The zoomed-in plot shows the plane-of-sky view at the time of one predicted mutual event; the blue line is the projected relative orbit.
Current usage metrics show cumulative count of Article Views (full-text article views including HTML views, PDF and ePub downloads, according to the available data) and Abstracts Views on Vision4Press platform.
Data correspond to usage on the plateform after 2015. The current usage metrics is available 48-96 hours after online publication and is updated daily on week days.
Initial download of the metrics may take a while.