Open Access
Fig. A.2.
Download original image
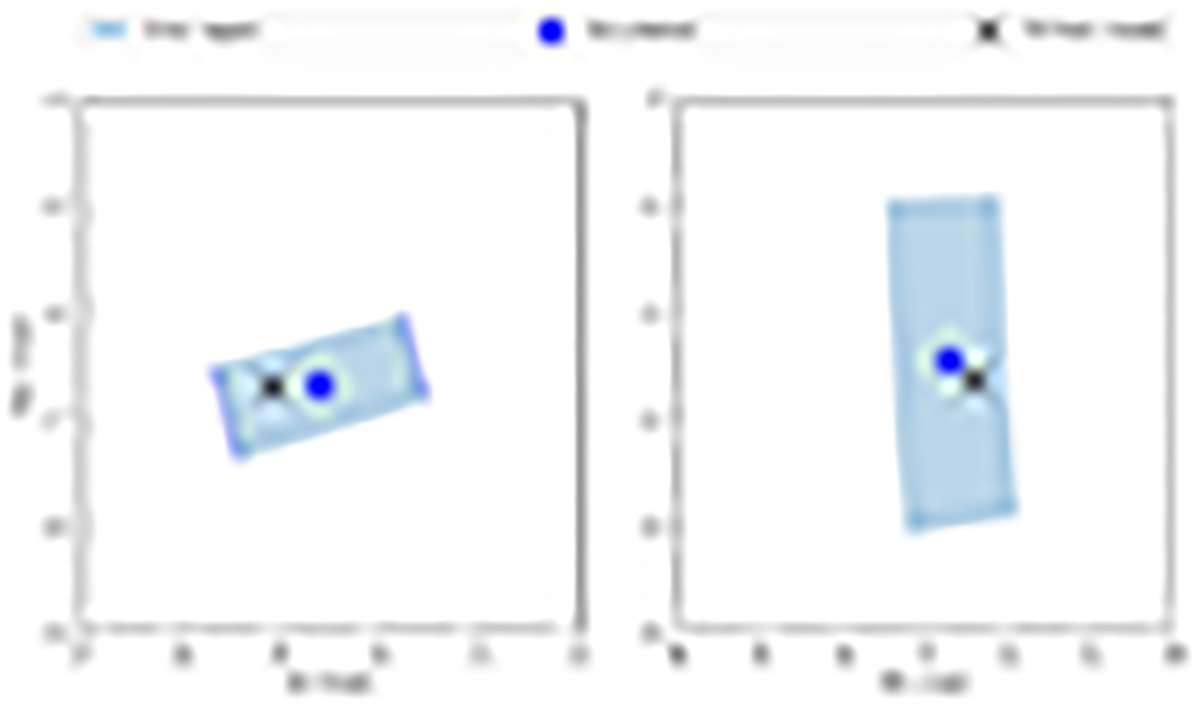
Residuals of the satellite position between the two observed occultations (blue dot) and the prediction (black cross). Left: 19 May 2021; Right: 9 June 2021. The primary’s position is at the centre (0,0). The shaded area is plotted following the error bar in Gault et al. (2022).
Current usage metrics show cumulative count of Article Views (full-text article views including HTML views, PDF and ePub downloads, according to the available data) and Abstracts Views on Vision4Press platform.
Data correspond to usage on the plateform after 2015. The current usage metrics is available 48-96 hours after online publication and is updated daily on week days.
Initial download of the metrics may take a while.