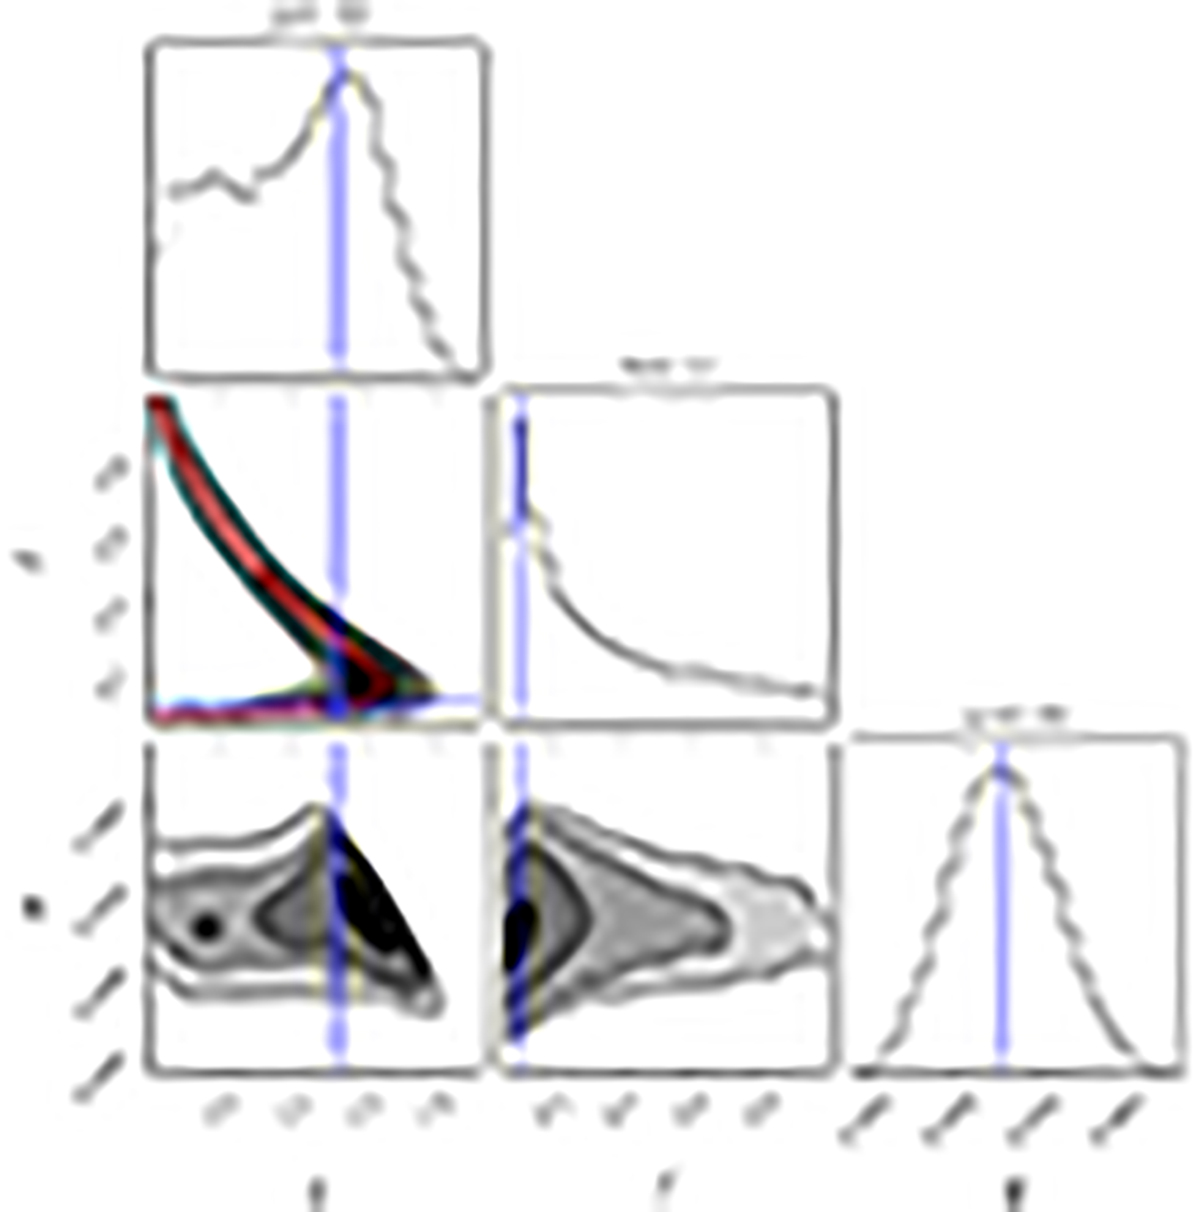
Fig. 2.
Download original image
Posterior distribution of the parameters s, f, and w. The astrometric wobble amplitude w is computed from the equation introduced in the text. The red line is plotted solving the relationship of f and s with w = 0.053 (median of its distribution). The blue line is taken at the mode of the distribution of f = 0.11, and we take it as one of the most probable solutions of this system. The corresponding value of s is 1.33.
Current usage metrics show cumulative count of Article Views (full-text article views including HTML views, PDF and ePub downloads, according to the available data) and Abstracts Views on Vision4Press platform.
Data correspond to usage on the plateform after 2015. The current usage metrics is available 48-96 hours after online publication and is updated daily on week days.
Initial download of the metrics may take a while.