Fig. 1.
Download original image
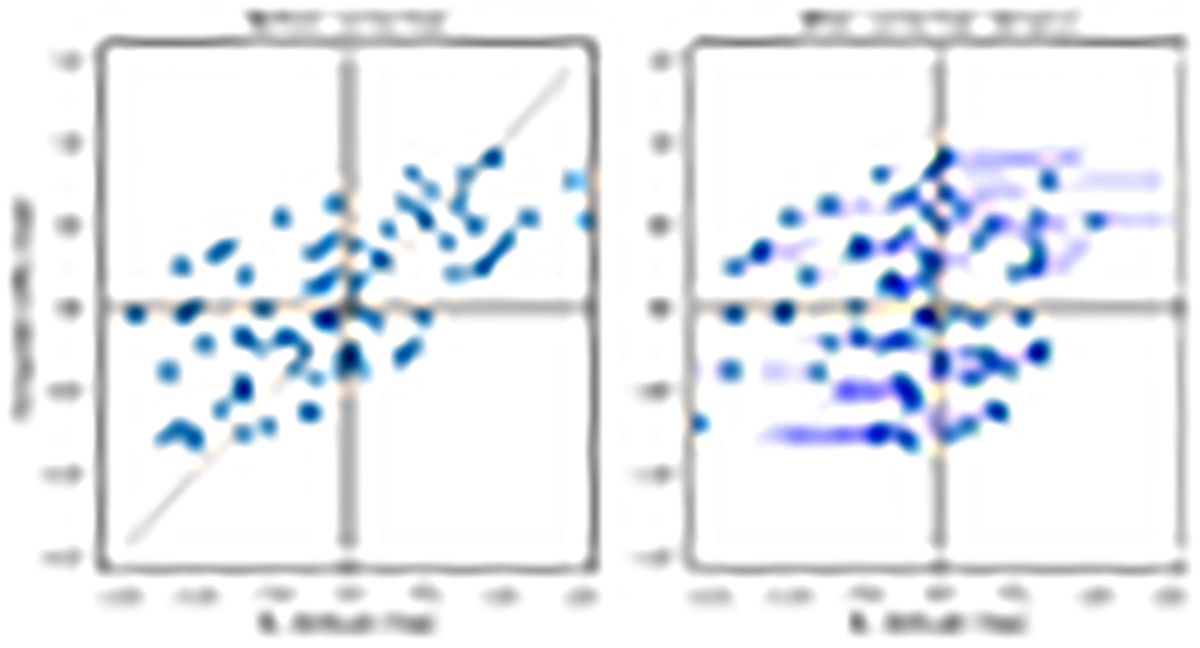
Comparison between the average heliocentric transit residuals and the computed binary photocentre–barycentre offsets. The right panel shows the equivalent plot after correcting for the computed shift. The horizontal lines represent the displacement between the data points before and after correction. A typical error bar, not shown in the figure, is of the order of 0.6 mas.
Current usage metrics show cumulative count of Article Views (full-text article views including HTML views, PDF and ePub downloads, according to the available data) and Abstracts Views on Vision4Press platform.
Data correspond to usage on the plateform after 2015. The current usage metrics is available 48-96 hours after online publication and is updated daily on week days.
Initial download of the metrics may take a while.