Fig. 4
Download original image
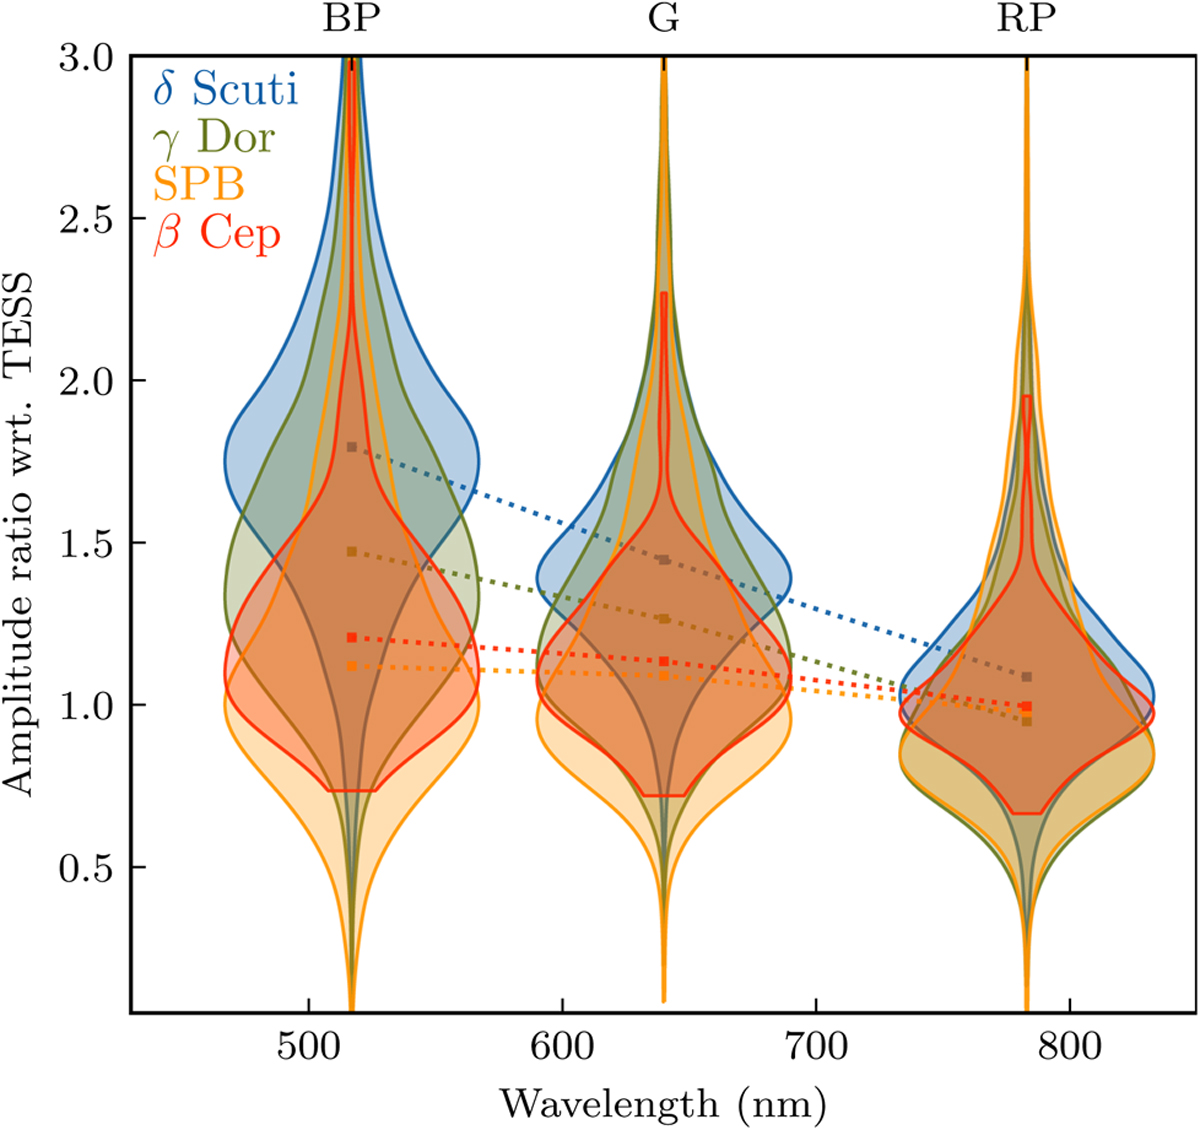
Violin plot of the amplitude ratios for the four samples deduced from the light curves in the three Gaia bandpasses with respect to the amplitude in the TESS band (covering approximately 600–1000 nm). The shaded regions indicate the density distributions for each of the samples, with the solid points showing the median. For clarity, we do not add the density distribution centred around 1.0 for the TESS bandpass itself.
Current usage metrics show cumulative count of Article Views (full-text article views including HTML views, PDF and ePub downloads, according to the available data) and Abstracts Views on Vision4Press platform.
Data correspond to usage on the plateform after 2015. The current usage metrics is available 48-96 hours after online publication and is updated daily on week days.
Initial download of the metrics may take a while.