Fig. 2
Download original image
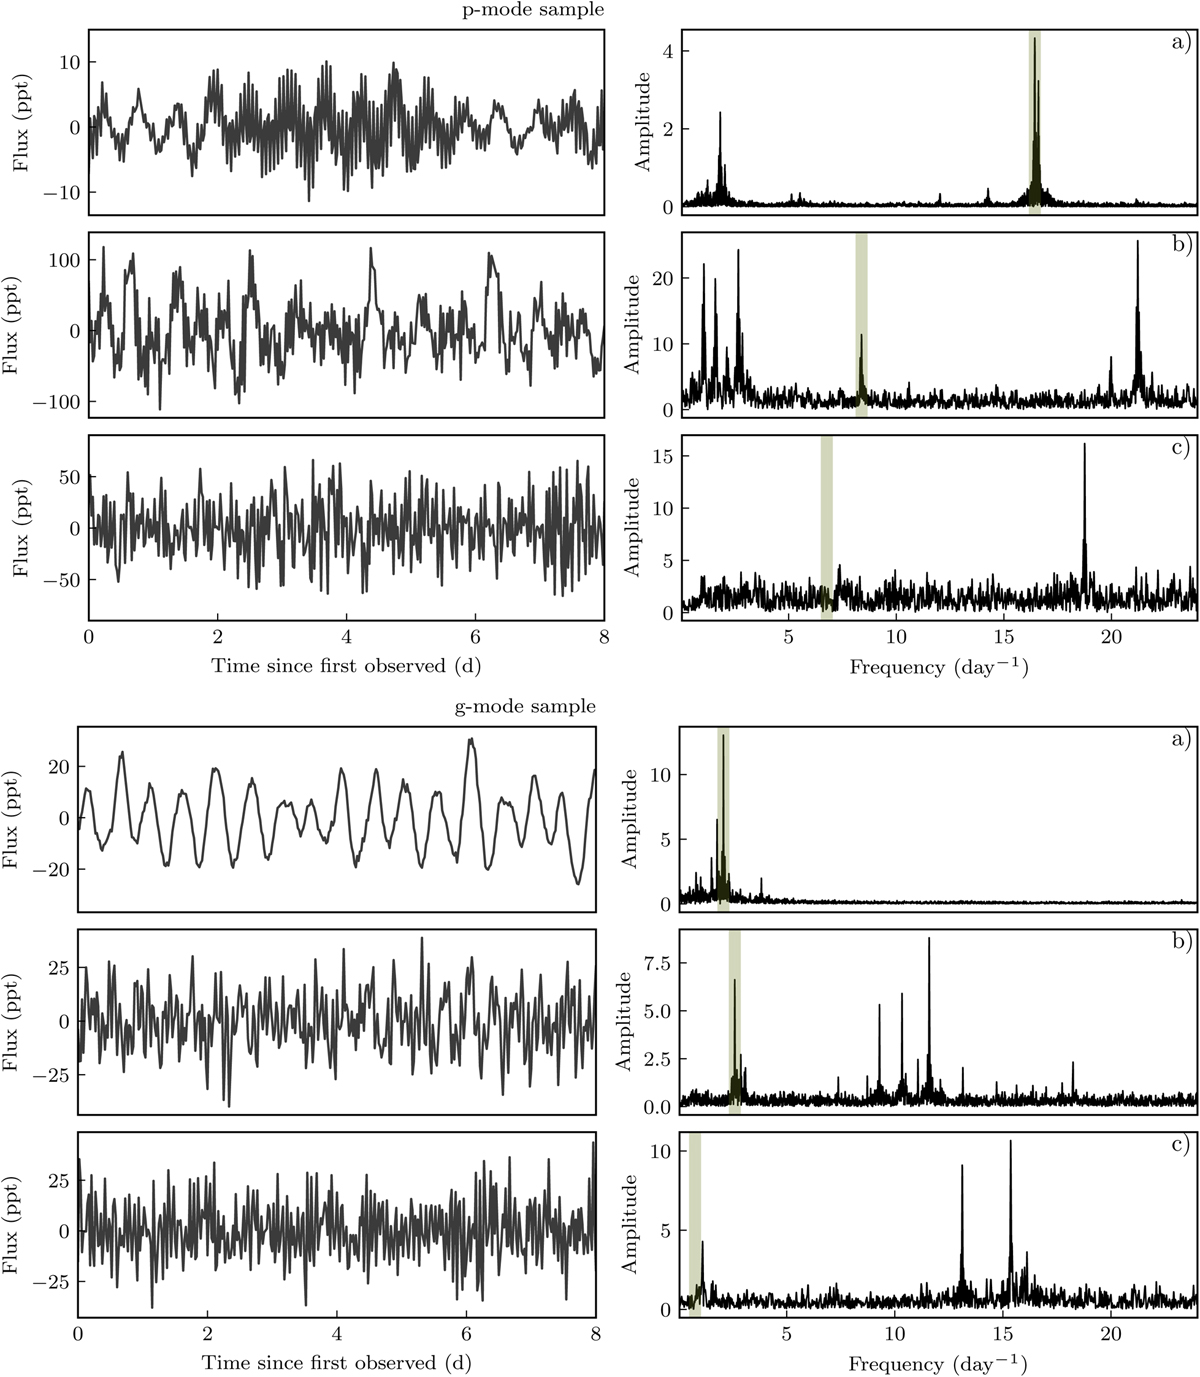
Example light curves and amplitude spectra from the p-mode (top three panels) and g-mode (bottom three panels) candidate sample. The green vertical line marks the measured Gaia frequency. We show the following cases: (a) where the measured Gaia frequency is in good agreement with TESS, (b) where the measured Gaia frequency is not the true dominant one, and (c) the measured Gaia frequency is incorrect.
Current usage metrics show cumulative count of Article Views (full-text article views including HTML views, PDF and ePub downloads, according to the available data) and Abstracts Views on Vision4Press platform.
Data correspond to usage on the plateform after 2015. The current usage metrics is available 48-96 hours after online publication and is updated daily on week days.
Initial download of the metrics may take a while.