Fig. 4
Download original image
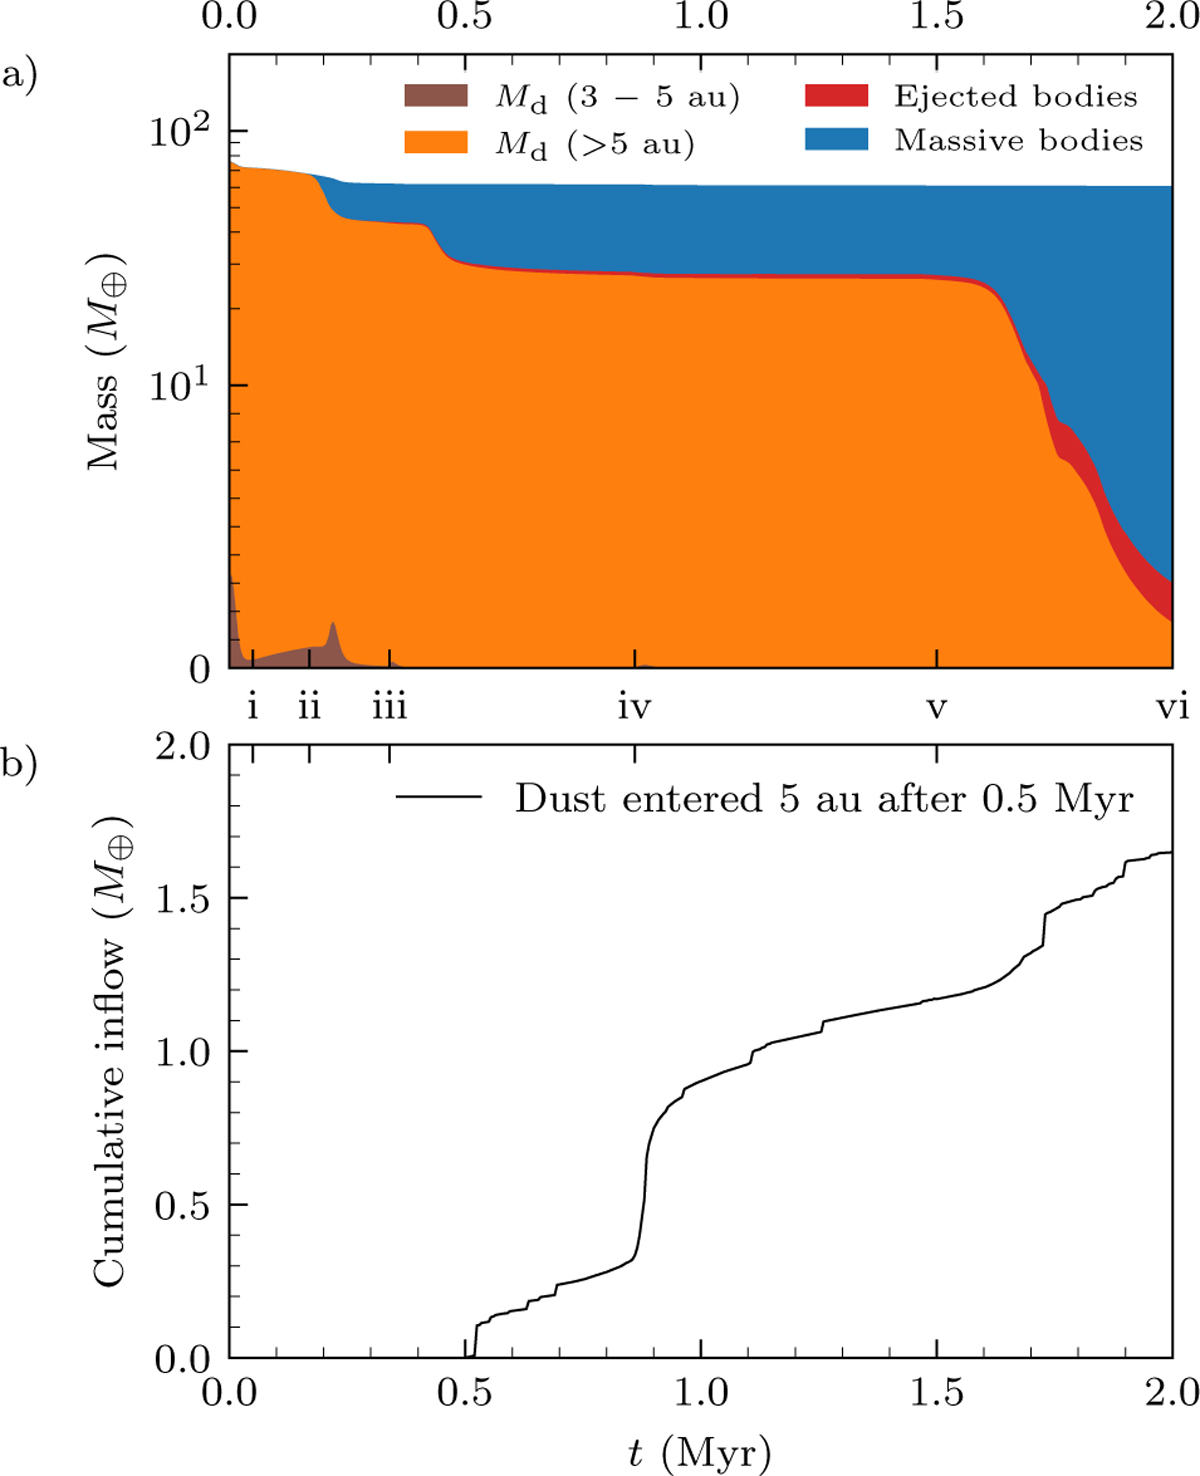
Evolution of the solid mass in the simulation with α = 5 × 10⁻⁴ that corresponds to the one presented by the colour blue in Figs. 2 and 3. The six timestamps in Fig. 2 are also denoted on the time axis. a) Solid mass budget. The solid mass is divided into four categories: the dust mass Md inside and outside of 5 au, solids bound in massive bodies and ejected massive bodies. It shows a high planet formation efficiency that the majority of solid mass (85% of the initial dust mass beyond 5 au) are converted into massive bodies. b) Cumulative inflow of dust entered 5 au after 0.5 Myr. A total of about 1.6 M⊕ of inflow to the inner disc is recorded over the next 1.5 Myr up to the end of the simulation.
Current usage metrics show cumulative count of Article Views (full-text article views including HTML views, PDF and ePub downloads, according to the available data) and Abstracts Views on Vision4Press platform.
Data correspond to usage on the plateform after 2015. The current usage metrics is available 48-96 hours after online publication and is updated daily on week days.
Initial download of the metrics may take a while.