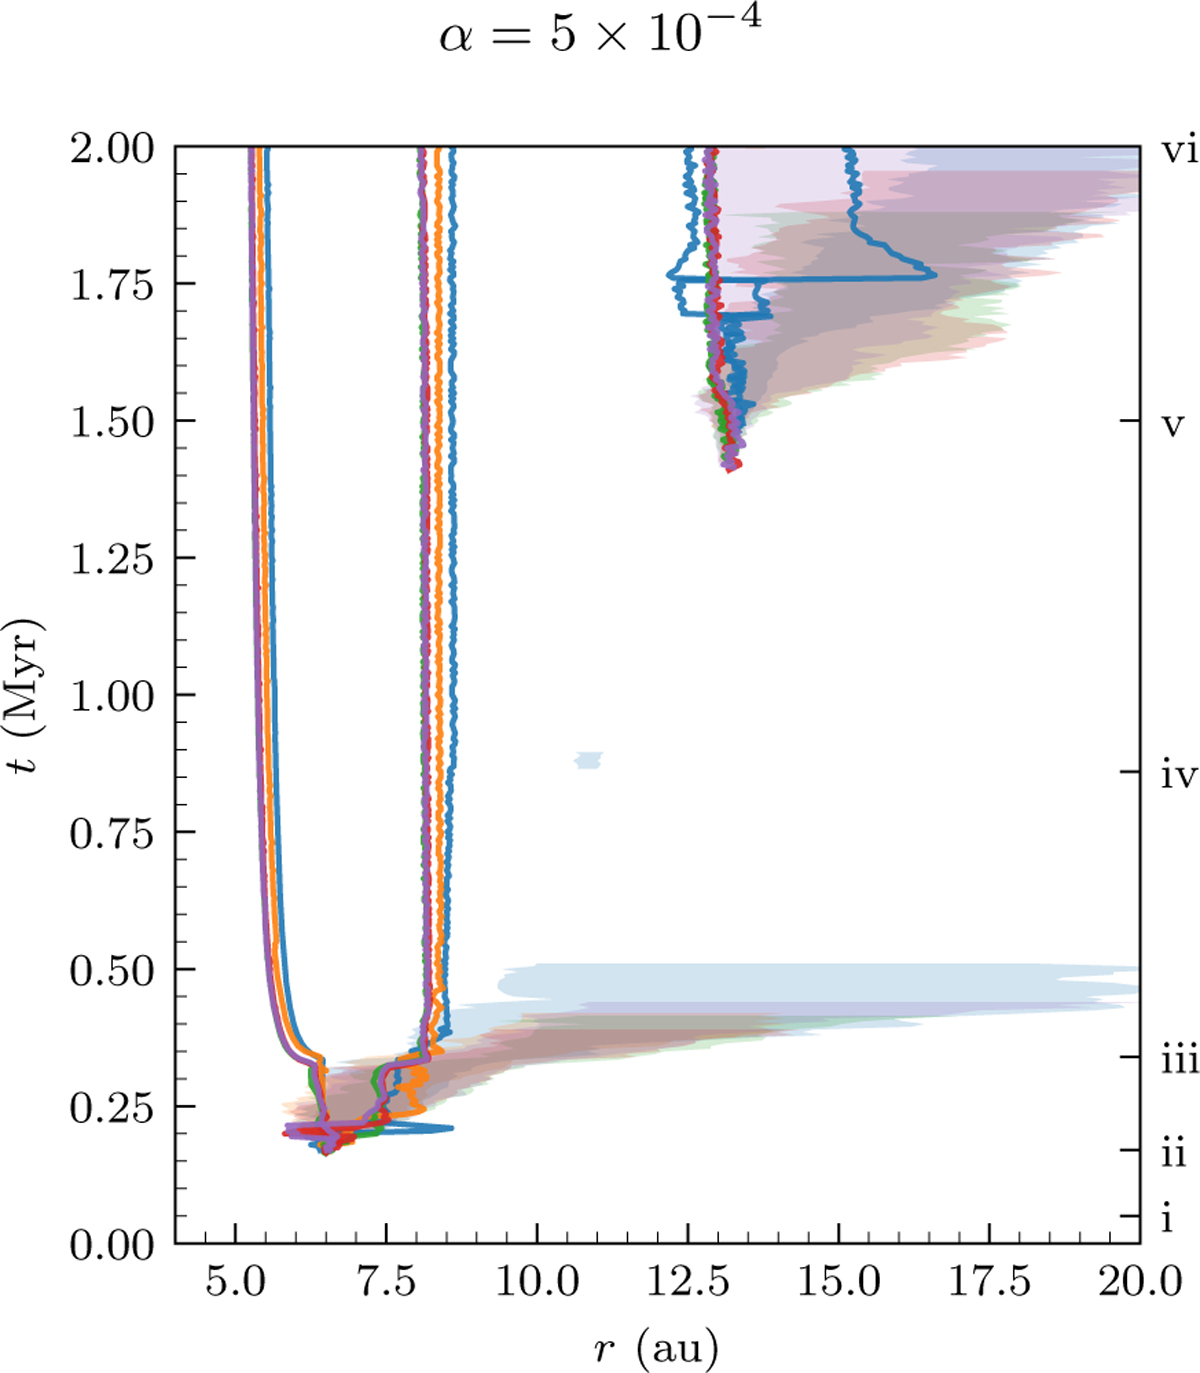
Fig. 3
Download original image
Tracks of the massive bodies in the simulation with α = 5 × 10⁻⁴. Each colour shows one of the five simulations corresponding to those in the final panel of Fig. 2, where the key timestamps are also denoted along the time axis on the right. The solid lines show the semimajor axis of the bodies reached 10 M⊕ by the end of the simulations. The shaded areas indicate the extents of the lower and upper quartiles of the semimajor axes of all bodies when the total number is above 50.
Current usage metrics show cumulative count of Article Views (full-text article views including HTML views, PDF and ePub downloads, according to the available data) and Abstracts Views on Vision4Press platform.
Data correspond to usage on the plateform after 2015. The current usage metrics is available 48-96 hours after online publication and is updated daily on week days.
Initial download of the metrics may take a while.