| Issue |
A&A
Volume 688, August 2024
|
|
|---|---|---|
| Article Number | A41 | |
| Number of page(s) | 2 | |
| Section | Stellar structure and evolution | |
| DOI | https://doi.org/10.1051/0004-6361/202450463 | |
| Published online | 30 July 2024 | |
Comment on Ádám et al. (2023): Large fraction of already known systems reported
Charles University, Faculty of Mathematics and Physics, Astronomical Institute, V Holešovičkách 2, 180 00 Praha 8, Czech Republic
e-mail: This email address is being protected from spambots. You need JavaScript enabled to view it.
Received:
22
April
2024
Accepted:
2
June
2024
Abstract
In this work, I report that large fraction of stars detected by Ádám et al. (2023, A&A, 674, A170) and noted in that work as new discoveries are in fact known systems. This is especially true for the dense bulge fields with large blending of nearby sources. Among the published 245 stars determined to be doubly eclipsing (i.e. containing two eclipsing signals), I identified 53 blends. In other words, about a quarter of the systems noted by Ádám et al. (2023, A&A, 674, A170) are not actually doubly eclipsing; rather, these are contaminations of known nearby sources that have already been detected by OGLE. Such a high proportion of reported false positives should not be readily ignored and ought to be addressed in future studies.
Key words: binaries: eclipsing
© The Authors 2024
 Open Access article, published by EDP Sciences, under the terms of the Creative Commons Attribution License (https://creativecommons.org/licenses/by/4.0), which permits unrestricted use, distribution, and reproduction in any medium, provided the original work is properly cited.
This article is published in open access under the Subscribe to Open model. This email address is being protected from spambots. You need JavaScript enabled to view it. to support open access publication.
1. Introduction
About one year ago, Ádám et al. (2023) published a study on the OGLE-IV catalogue, with an aim to identify stars with additional signals besides the dominant one. The authors presented altogether 292 such new systems, together with their preliminary characteristics and types (i.e. period and type of variability). According to their statement, they ‘determined whether it is a new variable or just the result of contamination by an already catalogued nearby one’ (abstract in Ádám et al. 2023). When following up on these results, we came to a very different conclusion. In addition, those authors noted that they had excluded those that had resulted from the ‘contamination by known OGLE variables from our catalogue’. This amounted to 292 new variable stars, which the authors listed in their Table B.1. In this work, I present the stars that had been missed in this step, which led to a sharp artificial increase in the statistics published in the cited work.
2. Known nearby variables
For the detection of known variables in the vicinity of the particular target, we also used the same source as Ádám et al. (2023), namely, is the OGLE-IV catalogue from Soszyński et al. (2016). The area scanned for detections was set to 10″ around the target, where I tried to identify the source of the signal from Soszyński et al. (2016) with the same period as given by Ádám et al. (2023).
The serious blending problem is usually related to the photometric data obtained on large pixels with poor angular resolution (e.g. TESS with its 21″ px−1, see Ricker et al. 2015). However, for the OGLE-IV data, this is problematic only in very dense stellar fields in the galactic bulge. In controlling all the presented 245 new systems with two eclipsing periods by Ádám et al. (2023), there were 53 nearby sources of this additional signal identified. Hence, the 53 false positives presented by Ádám et al. (2023) represents almost a quarter of all their reported systems. These stars are given in Table 1, along with the true identification of the source of additional variation.
False positives from Ádám et al. (2023) together with a blending source identification.
One typical example of such a false positive is shown in Figure 1, drawn from the first system in our Table 1. We can clearly see the appropriate period for the particular star. Both signals are present on both stars thanks to their close angular distance (about 1.07″ only), but identifying which star the period belongs to is straightforward.
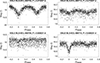 |
Fig. 1. Typical example of two close stars OGLE-BLG-ECL-85704 and OGLE-BLG-ECL-85710 (separated about 1.07″) with two different periods. Each of the periods clearly belongs to one particular target and the residual signal is only due to light contamination. |
As an additional cross-check, we also tried to identify similar periods (or their double and/or half values) from other photometric data. We used the old ASAS-3 database (Pojmanski 1998, 2002), searching in the 2′ radius around a star, as well as the ASAS-SN database (Kochanek et al. 2017; Jayasinghe et al. 2018), also within the same radius. Finally, we used Gaia DR3 (Gaia Collaboration 2023) and stars in the 70″ radius were scanned. As a result, no other positive detection of both eclipsing periods in these databases was found. From the remaining 192 systems for 23 stars, their more prominent periods were also identified in the Gaia DR3 variability tables.
3. Conclusions
The blending problem of light contamination from nearby sources is less obvious for the OGLE-IV data (angular resolution of about 0.417″ px−1) than for TESS data. However, in dense stellar fields, this can pose a serious problem to classification procedures. Therefore, it is important to make an effort to identify false positives such as those presented in the paper by Ádám et al. (2023), as a necessary step in any such analysis.
Acknowledgments
We do thank the OGLE team for making all of the observations easily public available. This research has made use of the SIMBAD and VIZIER databases, operated at CDS, Strasbourg, France and of NASA Astrophysics Data System Bibliographic Services. This work has made use of data from the European Space Agency (ESA) mission Gaia (https://www.cosmos.esa.int/gaia), processed by the Gaia Data Processing and Analysis Consortium (DPAC, https://www.cosmos.esa.int/web/gaia/dpac/consortium). Funding for the DPAC has been provided by national institutions, in particular the institutions participating in the Gaia Multilateral Agreement.
References
- Ádám, R. Z., Hajdu, T., Bódi, A., et al. 2023, A&A, 674, A170 [NASA ADS] [CrossRef] [EDP Sciences] [Google Scholar]
- Gaia Collaboration (Vallenari, A., et al.) 2023, A&A, 674, A1 [NASA ADS] [CrossRef] [EDP Sciences] [Google Scholar]
- Jayasinghe, T., Kochanek, C. S., Stanek, K. Z., et al. 2018, MNRAS, 477, 3145 [Google Scholar]
- Kochanek, C. S., Shappee, B. J., Stanek, K. Z., et al. 2017, PASP, 129, 104502a [NASA ADS] [CrossRef] [Google Scholar]
- Pojmanski, G. 1998, Acta Astron., 48, 35 [Google Scholar]
- Pojmanski, G. 2002, Acta Astron., 52, 397 [NASA ADS] [Google Scholar]
- Ricker, G. R., Winn, J. N., Vanderspek, R., et al. 2015, JATIS, 1, 014003 [Google Scholar]
- Soszyński, I., Pawlak, M., Pietrukowicz, P., et al. 2016, Acta Astron., 66, 405 [NASA ADS] [Google Scholar]
All Tables
False positives from Ádám et al. (2023) together with a blending source identification.
All Figures
|
Fig. 1. Typical example of two close stars OGLE-BLG-ECL-85704 and OGLE-BLG-ECL-85710 (separated about 1.07″) with two different periods. Each of the periods clearly belongs to one particular target and the residual signal is only due to light contamination. |
| In the text | |
Current usage metrics show cumulative count of Article Views (full-text article views including HTML views, PDF and ePub downloads, according to the available data) and Abstracts Views on Vision4Press platform.
Data correspond to usage on the plateform after 2015. The current usage metrics is available 48-96 hours after online publication and is updated daily on week days.
Initial download of the metrics may take a while.