Fig. 5
Download original image
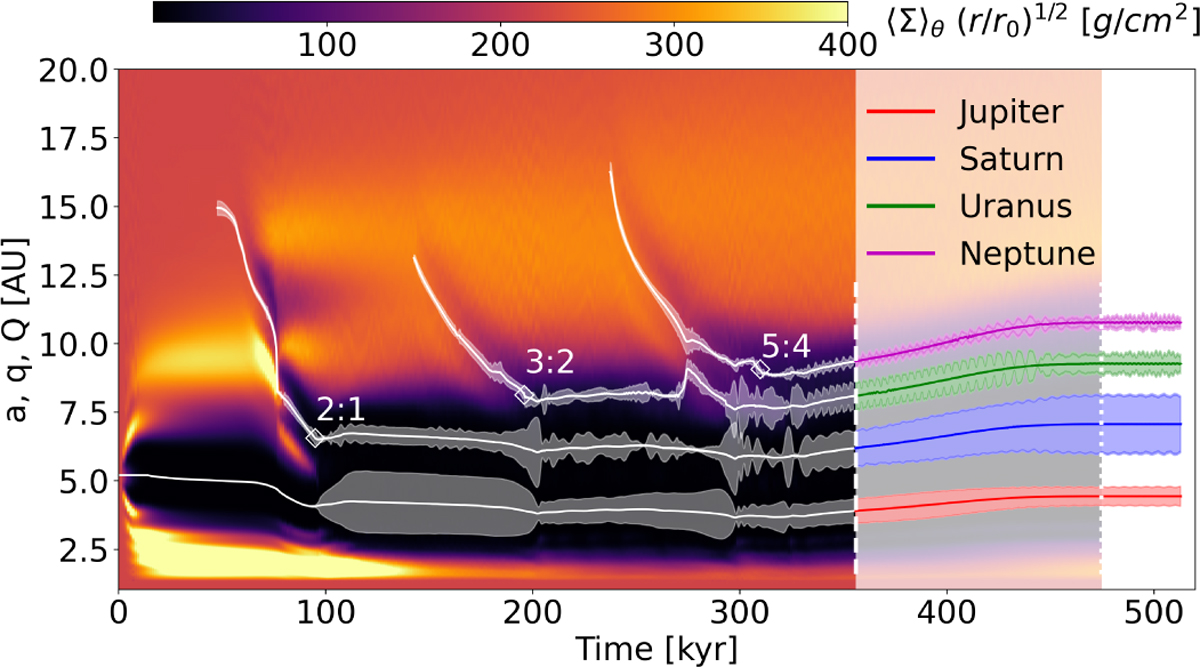
Similar to Fig. 2, this figure shows the orbital parameters of the four giant planets evolving in a colder disc, so lower aspect ratio, simulation C42. Additionally, the background of the figure shows the azimuthaly averaged surface density profile of the disc as a function of time throughout the simulation. For the sake of clarity, the left half of the plot shows all the planets’ orbital parameters in white. In the second half of the plot, from about 350 kyr, the phase of the gas disc’s dispersal is initiated. The vertical dashed and dotted lines mark the start t0 and end tf of this phase (see section Sec. 2.4 for more details). The system is stable in the resonance chain (2:1, 3:2, 5:4).
Current usage metrics show cumulative count of Article Views (full-text article views including HTML views, PDF and ePub downloads, according to the available data) and Abstracts Views on Vision4Press platform.
Data correspond to usage on the plateform after 2015. The current usage metrics is available 48-96 hours after online publication and is updated daily on week days.
Initial download of the metrics may take a while.