Fig. 2
Download original image
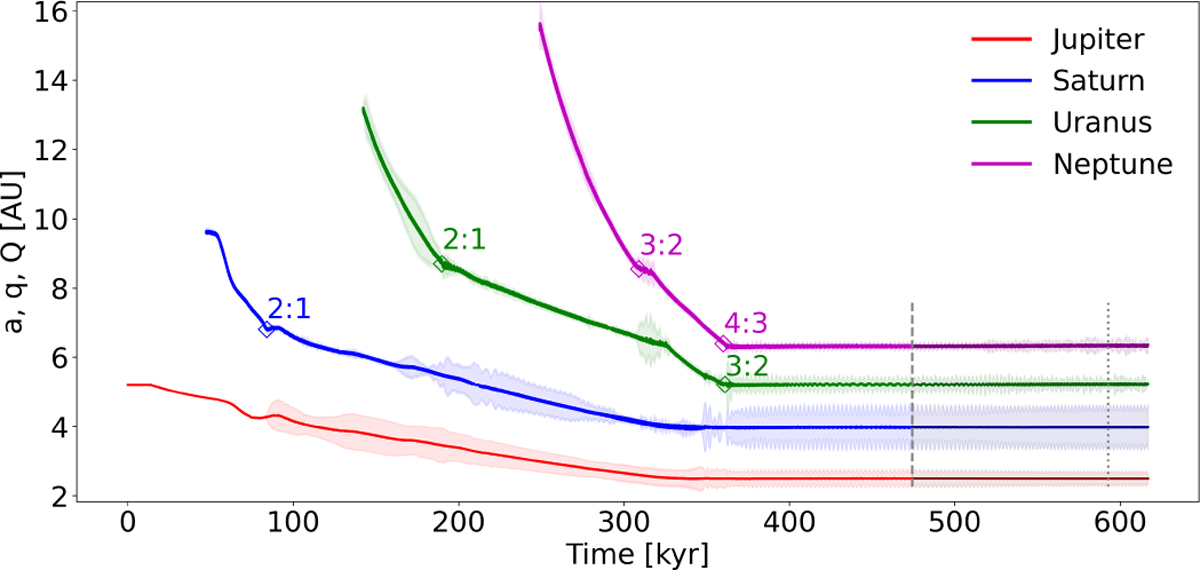
Evolution of the orbital parameters of the four planets in the nominal simulation N4. The shaded areas mark the positions of the peri- and apo-centre of the planets, q = a(1 − e) and Q = a(1 + e), respectively. The beginning of the plot up to about 150 000 yr shows the nominal simulation N of Griveaud et al. (2023). Uranus and Neptune are added consecutively in the simulation and the final resonance chain is (2:1, 3:2, 4:3). Here Neptune’s introduction time was TN,0 = 250000 yr (see Fig. 3). The dashed and dotted vertical lines indicate the time at which the mock disc dispersal is respectively started (t0) and ended (tf); see Sec. 2.4 for more details.
Current usage metrics show cumulative count of Article Views (full-text article views including HTML views, PDF and ePub downloads, according to the available data) and Abstracts Views on Vision4Press platform.
Data correspond to usage on the plateform after 2015. The current usage metrics is available 48-96 hours after online publication and is updated daily on week days.
Initial download of the metrics may take a while.