Fig. 3
Download original image
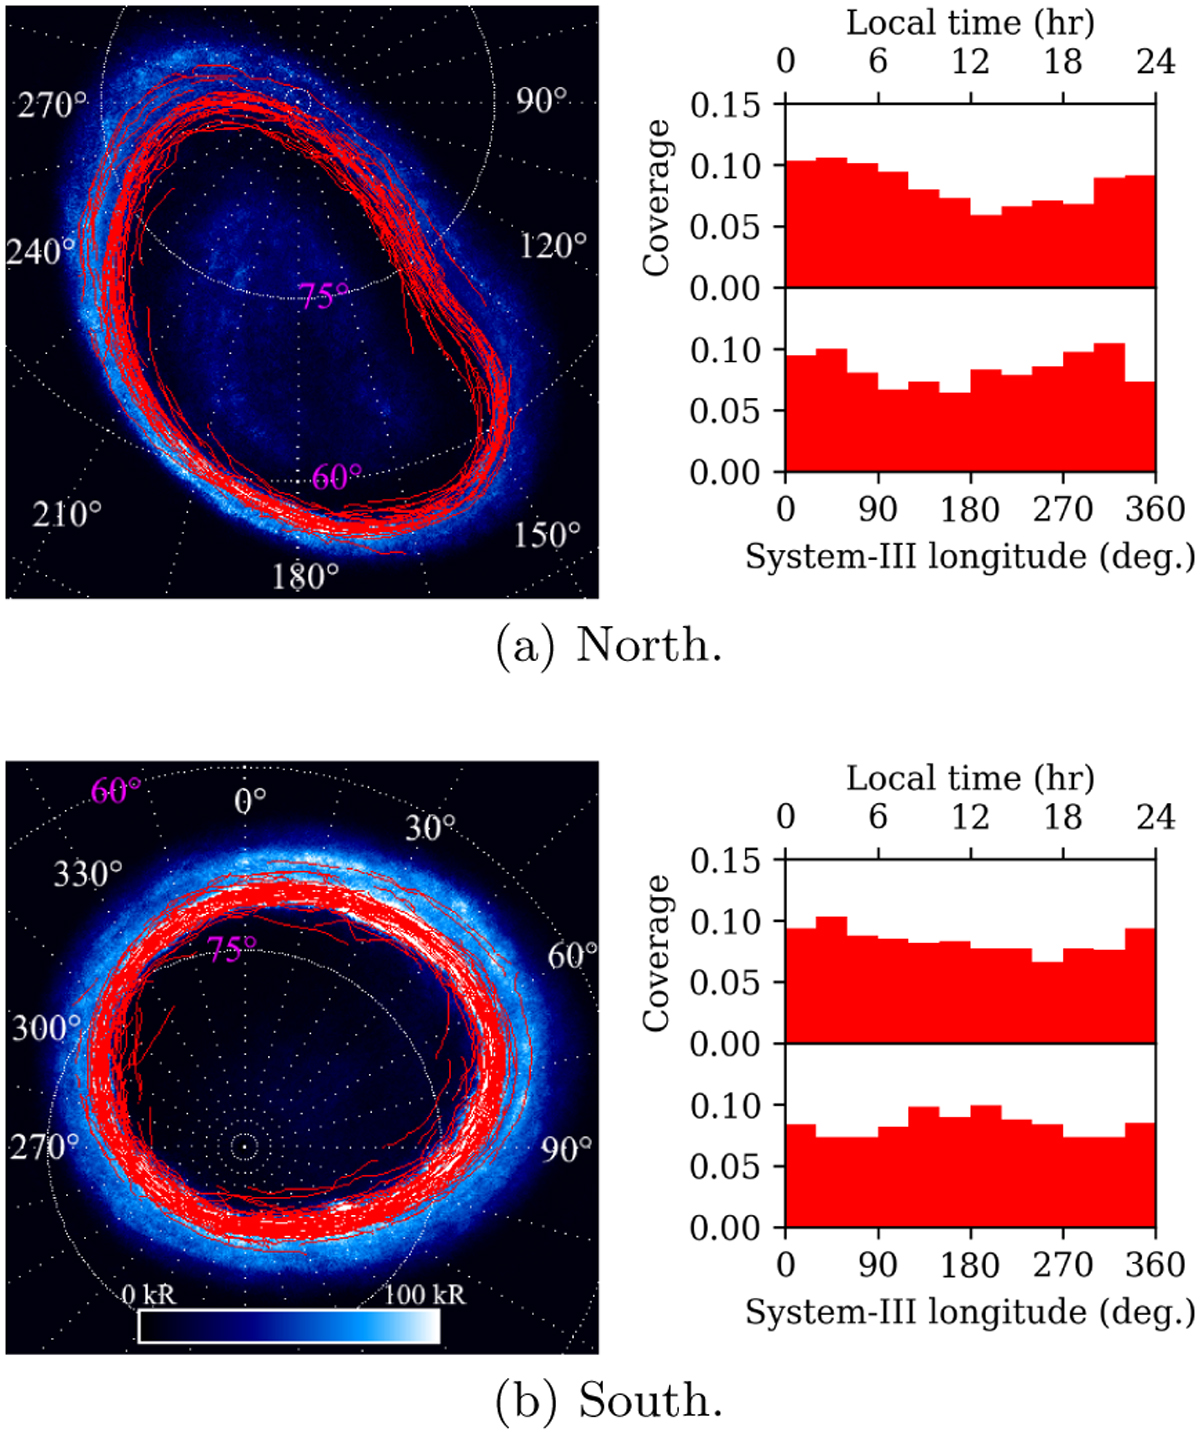
Detected ME arcs for perijoves 1 through 54, shown in red, overlain on the pixelwise median-average aurora for each hemisphere. A 15°-by-15° grid in System-III longitude and planetocentric latitude is overlain on the aurora. The System-III longitude of certain gridlines are given in white, and the planetocentric latitudes of certain gridlines in magenta. The brightness scale of the images of the aurora in kR is given at the bottom of (b). A histogram of the distribution of detected ME arcs in both local time (top) and System-III longitude (bottom) is given for both the northern and southern hemispheres.
Current usage metrics show cumulative count of Article Views (full-text article views including HTML views, PDF and ePub downloads, according to the available data) and Abstracts Views on Vision4Press platform.
Data correspond to usage on the plateform after 2015. The current usage metrics is available 48-96 hours after online publication and is updated daily on week days.
Initial download of the metrics may take a while.