Fig. 10
Download original image
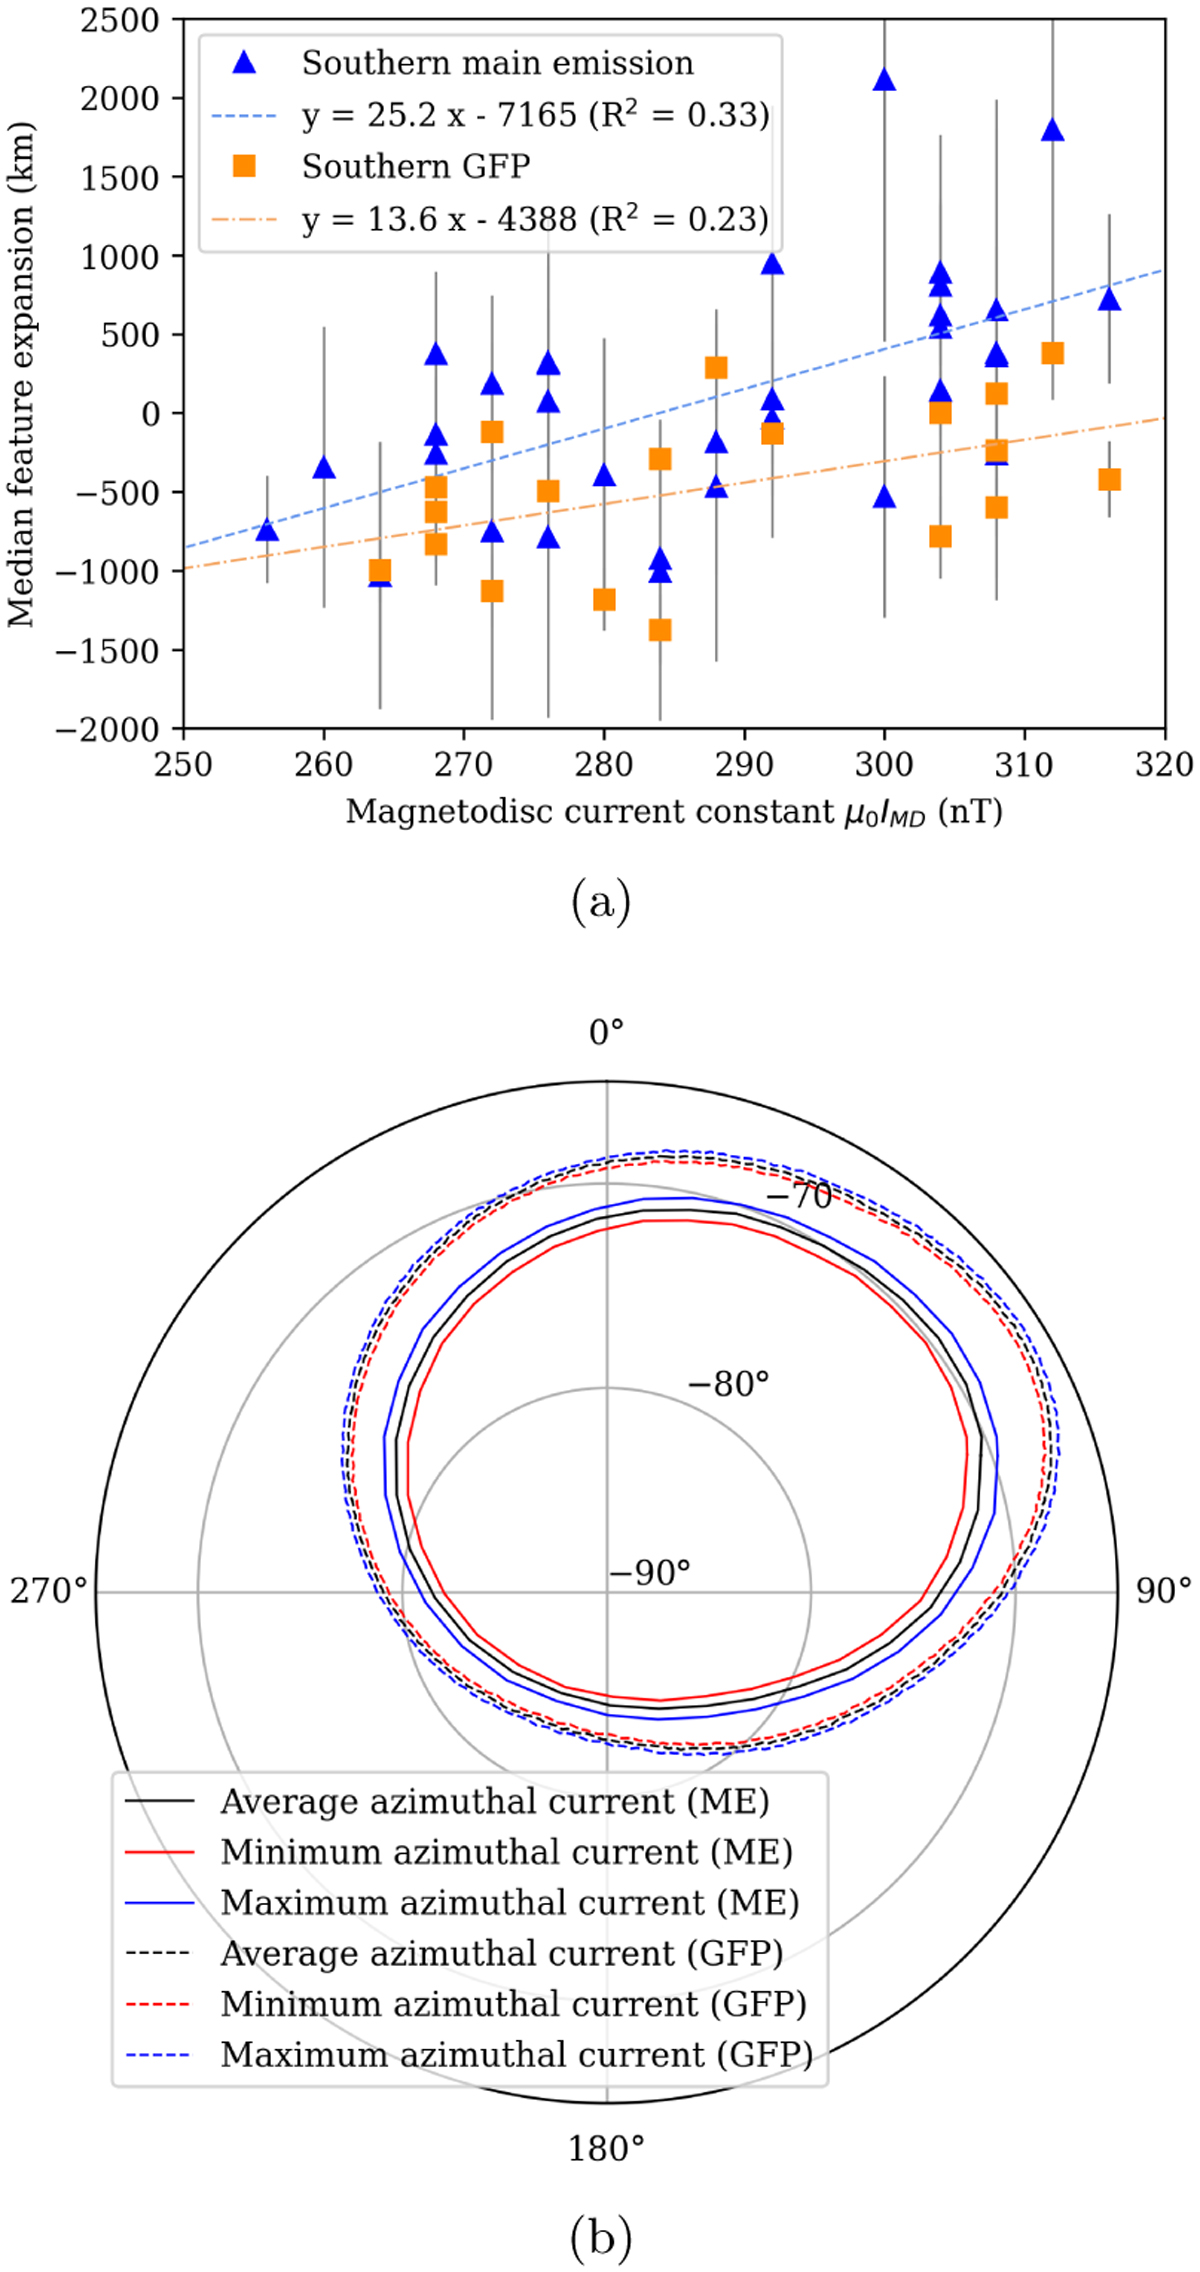
(a) Magnetodisc current constant fitted to perijoves 1 through 34 after Vogt et al. (2022a) vs. the median-averaged global expansion of the ME relative to the UVS reference oval and the expansion of the Ganymede auroral footprint relative to its mapped contour at 900 km, in the southern hemisphere. The global ME expansion in the south is denoted by blue triangles, and the expansion of the southern Ganymede footprint by orange squares. The fitted relation between the ME expansion and the current constant is denoted by a blue dashed line, and that between the Ganymede-footprint location and the current constant by an orange dot-dashed line. The form and R-squared goodness-of-fit values of the fitted relations are given in the legend. (b) Auroral mapping of the southern UVS ME reference oval (solid lines) and the southern GFP (dashed lines) using the JRM33 + Con2020 magnetic-field model with azimuthal current constants equivalent to the average (288 nT, black), minimum (256 nT, red, innermost), and maximum (316 nT, blue, outermost) values shown in (a). The System-III longitudes of gridlines are annotated around the outside of the plot, and the planetocentric latitudes next to circular gridlines.
Current usage metrics show cumulative count of Article Views (full-text article views including HTML views, PDF and ePub downloads, according to the available data) and Abstracts Views on Vision4Press platform.
Data correspond to usage on the plateform after 2015. The current usage metrics is available 48-96 hours after online publication and is updated daily on week days.
Initial download of the metrics may take a while.