Open Access
Fig. 9
Download original image
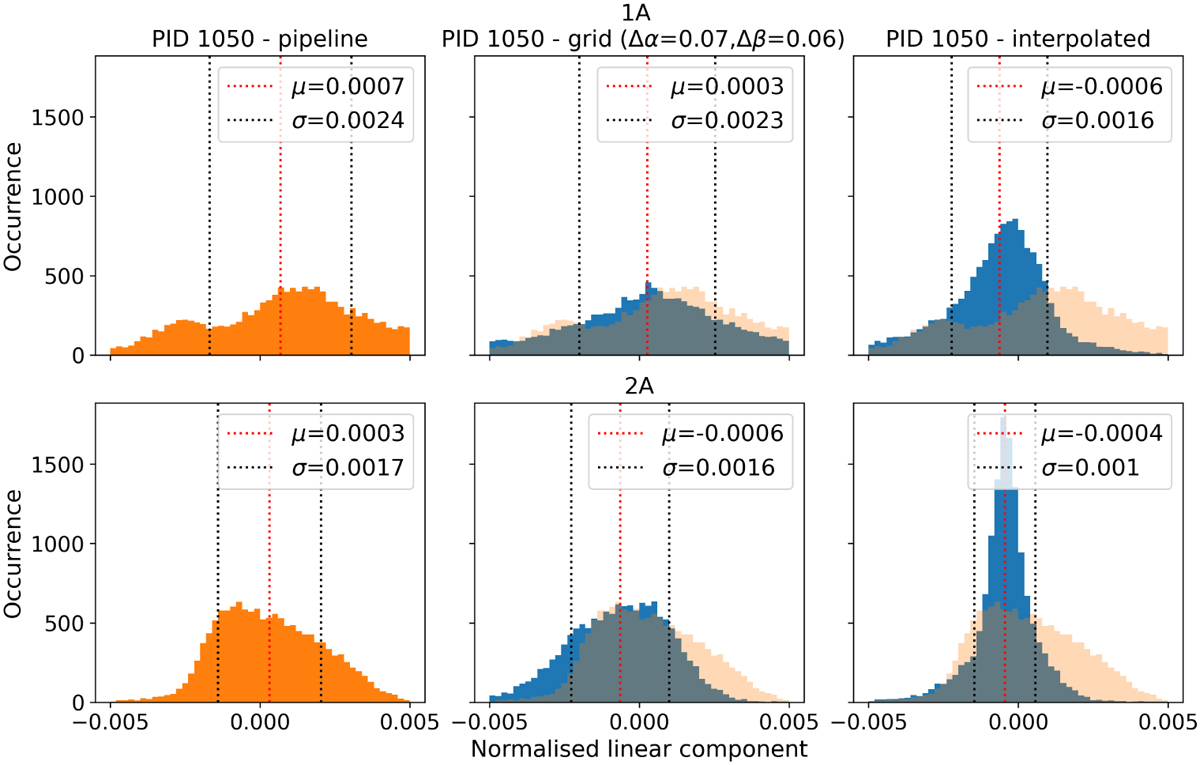
Remaining linear component in observation 7 of PID 1050 after correcting the ramps using the current pipeline files (left), the grid directly (middle), or the interpolated coefficients (right). The top row shows band 1A, and the bottom row band 2A.
Current usage metrics show cumulative count of Article Views (full-text article views including HTML views, PDF and ePub downloads, according to the available data) and Abstracts Views on Vision4Press platform.
Data correspond to usage on the plateform after 2015. The current usage metrics is available 48-96 hours after online publication and is updated daily on week days.
Initial download of the metrics may take a while.