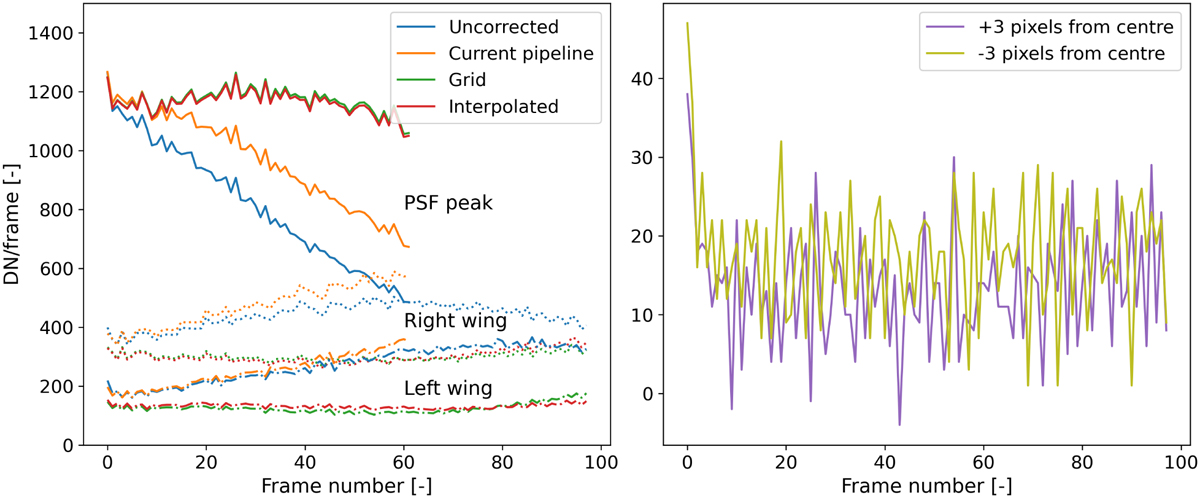
Fig. 7
Download original image
Frame differences of the ramps for the different calibration methods in the PSF centre ((x, y) = (415 940)), and the PSF wings ((x, y) = (414 940) and (x, y) = (416 940)), in band 1A (left). To better visualise the deviation from perfect linearity, we show the subsequent frame difference (DNi+1 − DNi). A perfectly linear ramp should be horizontal and straight. Note that the ramps in the panel on the left are cut at the saturation point. We also show the frame differences of the uncorrected ramps 3 pixels from the PSF centre (right).
Current usage metrics show cumulative count of Article Views (full-text article views including HTML views, PDF and ePub downloads, according to the available data) and Abstracts Views on Vision4Press platform.
Data correspond to usage on the plateform after 2015. The current usage metrics is available 48-96 hours after online publication and is updated daily on week days.
Initial download of the metrics may take a while.