Fig. 15
Download original image
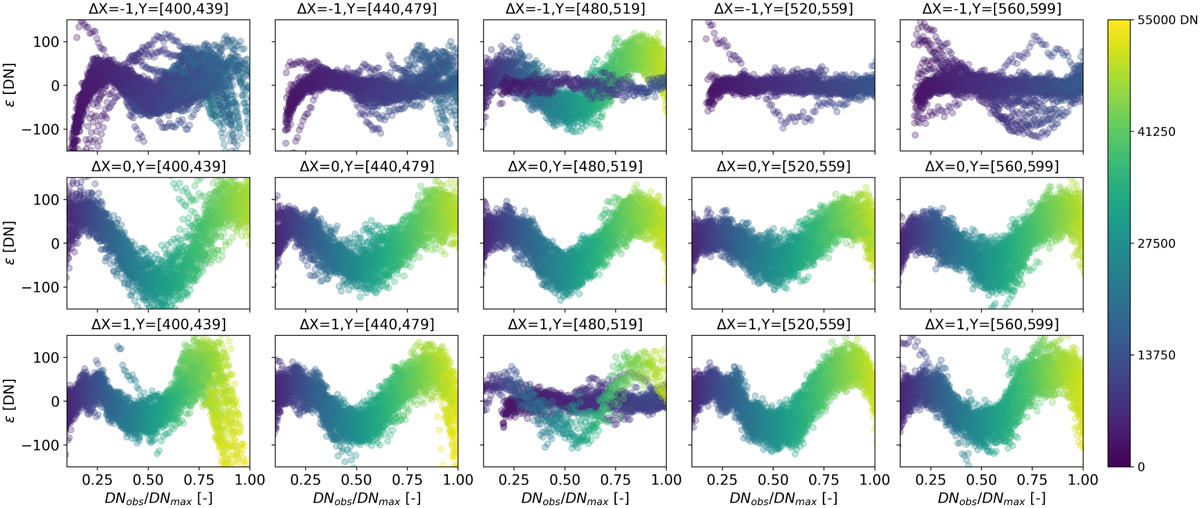
Residuals of linearised ramp after subtracting a linear fit. The X-offset is with respect to the brightest central pixel trace, while the Y-coordinates are a range. The x-axes are the observed DN of the original ramp, divided by the maximum DN-value reached. The colour map shows the DN-level of the specific time-sample indicated by the dot, where 55 000 DN roughly corresponds to the imposed saturation limit (55 030 DN). The residuals show a systematic sinusoid signature with DN-level reached, around a noise floor of approximately 50 DN.
Current usage metrics show cumulative count of Article Views (full-text article views including HTML views, PDF and ePub downloads, according to the available data) and Abstracts Views on Vision4Press platform.
Data correspond to usage on the plateform after 2015. The current usage metrics is available 48-96 hours after online publication and is updated daily on week days.
Initial download of the metrics may take a while.