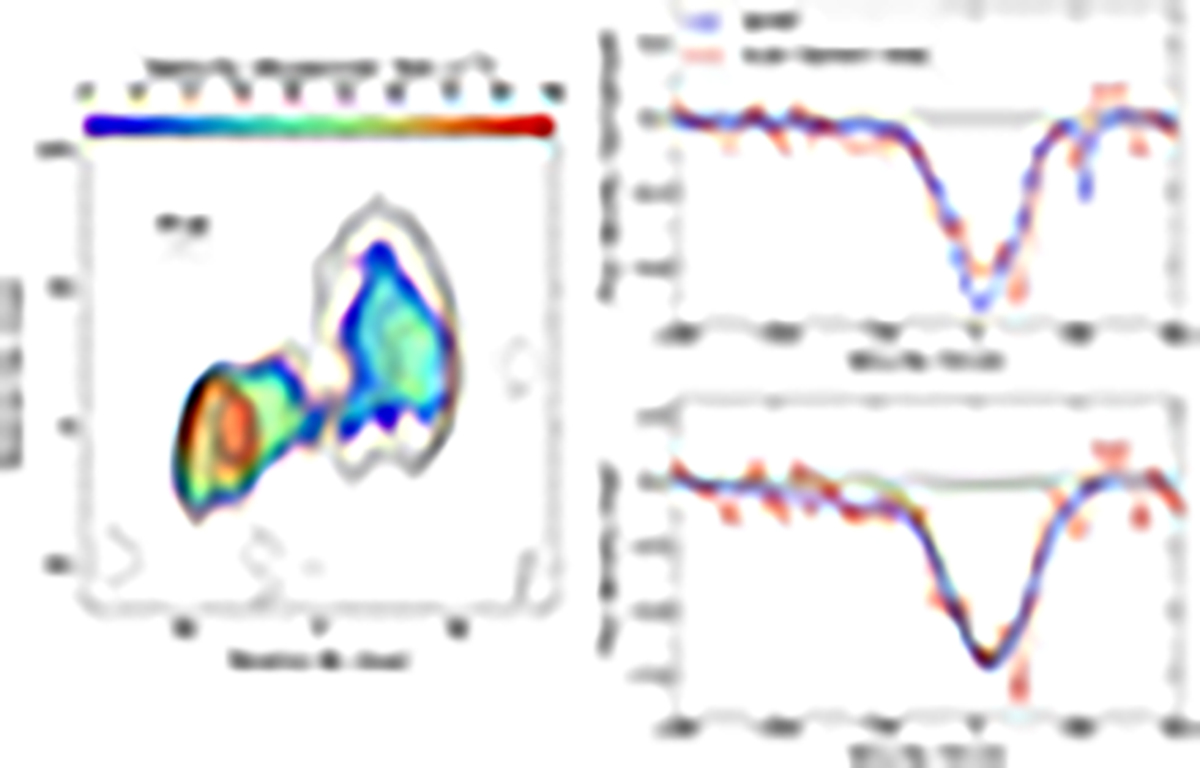
Fig. 4.
Download original image
Left: velocity dispersion map of the H I seen in absorption with our VLBI data, shown in colour. The grey contours represent the radio continuum with the same contour levels as those in Fig. 1. The region where the shallow blueshifted wing is detected is surrounded with a black contour; this was ascertained by visual inspection. Top right: VLBI spectrum extracted from the region marked with the black contour in the velocity dispersion map – where the blueshifted, shallow wing is detected – compared with the WSRT spectrum. The spectra are normalised to emphasise the shallow wing in the VLBI spectrum. Bottom right: Gaussian fits to the deep and the shallow absorption features in the spectrum extracted from the region marked in black contour in the velocity dispersion map. The RMS noise on the VLBI spectrum is 0.7 mJy. See Sect. 4.2 for details.
Current usage metrics show cumulative count of Article Views (full-text article views including HTML views, PDF and ePub downloads, according to the available data) and Abstracts Views on Vision4Press platform.
Data correspond to usage on the plateform after 2015. The current usage metrics is available 48-96 hours after online publication and is updated daily on week days.
Initial download of the metrics may take a while.