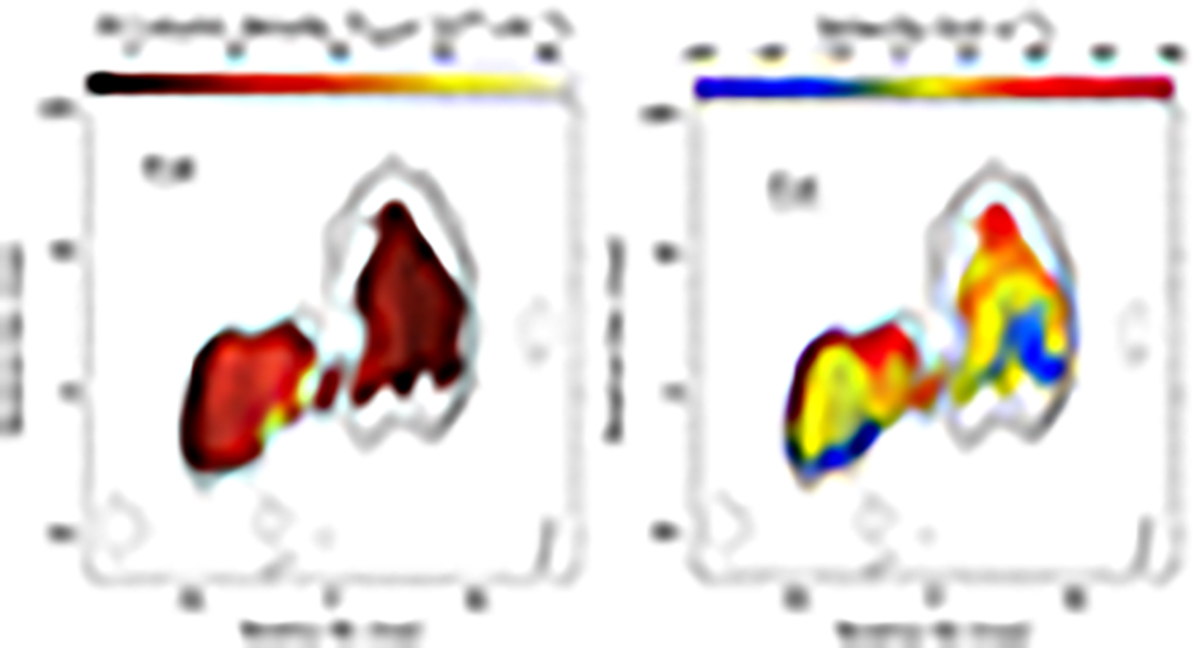
Fig. 3.
Download original image
Left: H I column density map of the gas seen in absorption in our VLBI data estimated assuming a gas spin temperature of 100 K. Right: velocity field of the gas detected in absorption, shown in colour. There is a slight velocity gradient along the western lobe and also along the parts of the eastern lobe closer to the core in the north–south direction while such a gradient is entirely missing along the rest of the eastern lobe. The contours in both images represent the radio continuum with the same contour levels as those in Fig. 1.
Current usage metrics show cumulative count of Article Views (full-text article views including HTML views, PDF and ePub downloads, according to the available data) and Abstracts Views on Vision4Press platform.
Data correspond to usage on the plateform after 2015. The current usage metrics is available 48-96 hours after online publication and is updated daily on week days.
Initial download of the metrics may take a while.