Fig. 4
Download original image
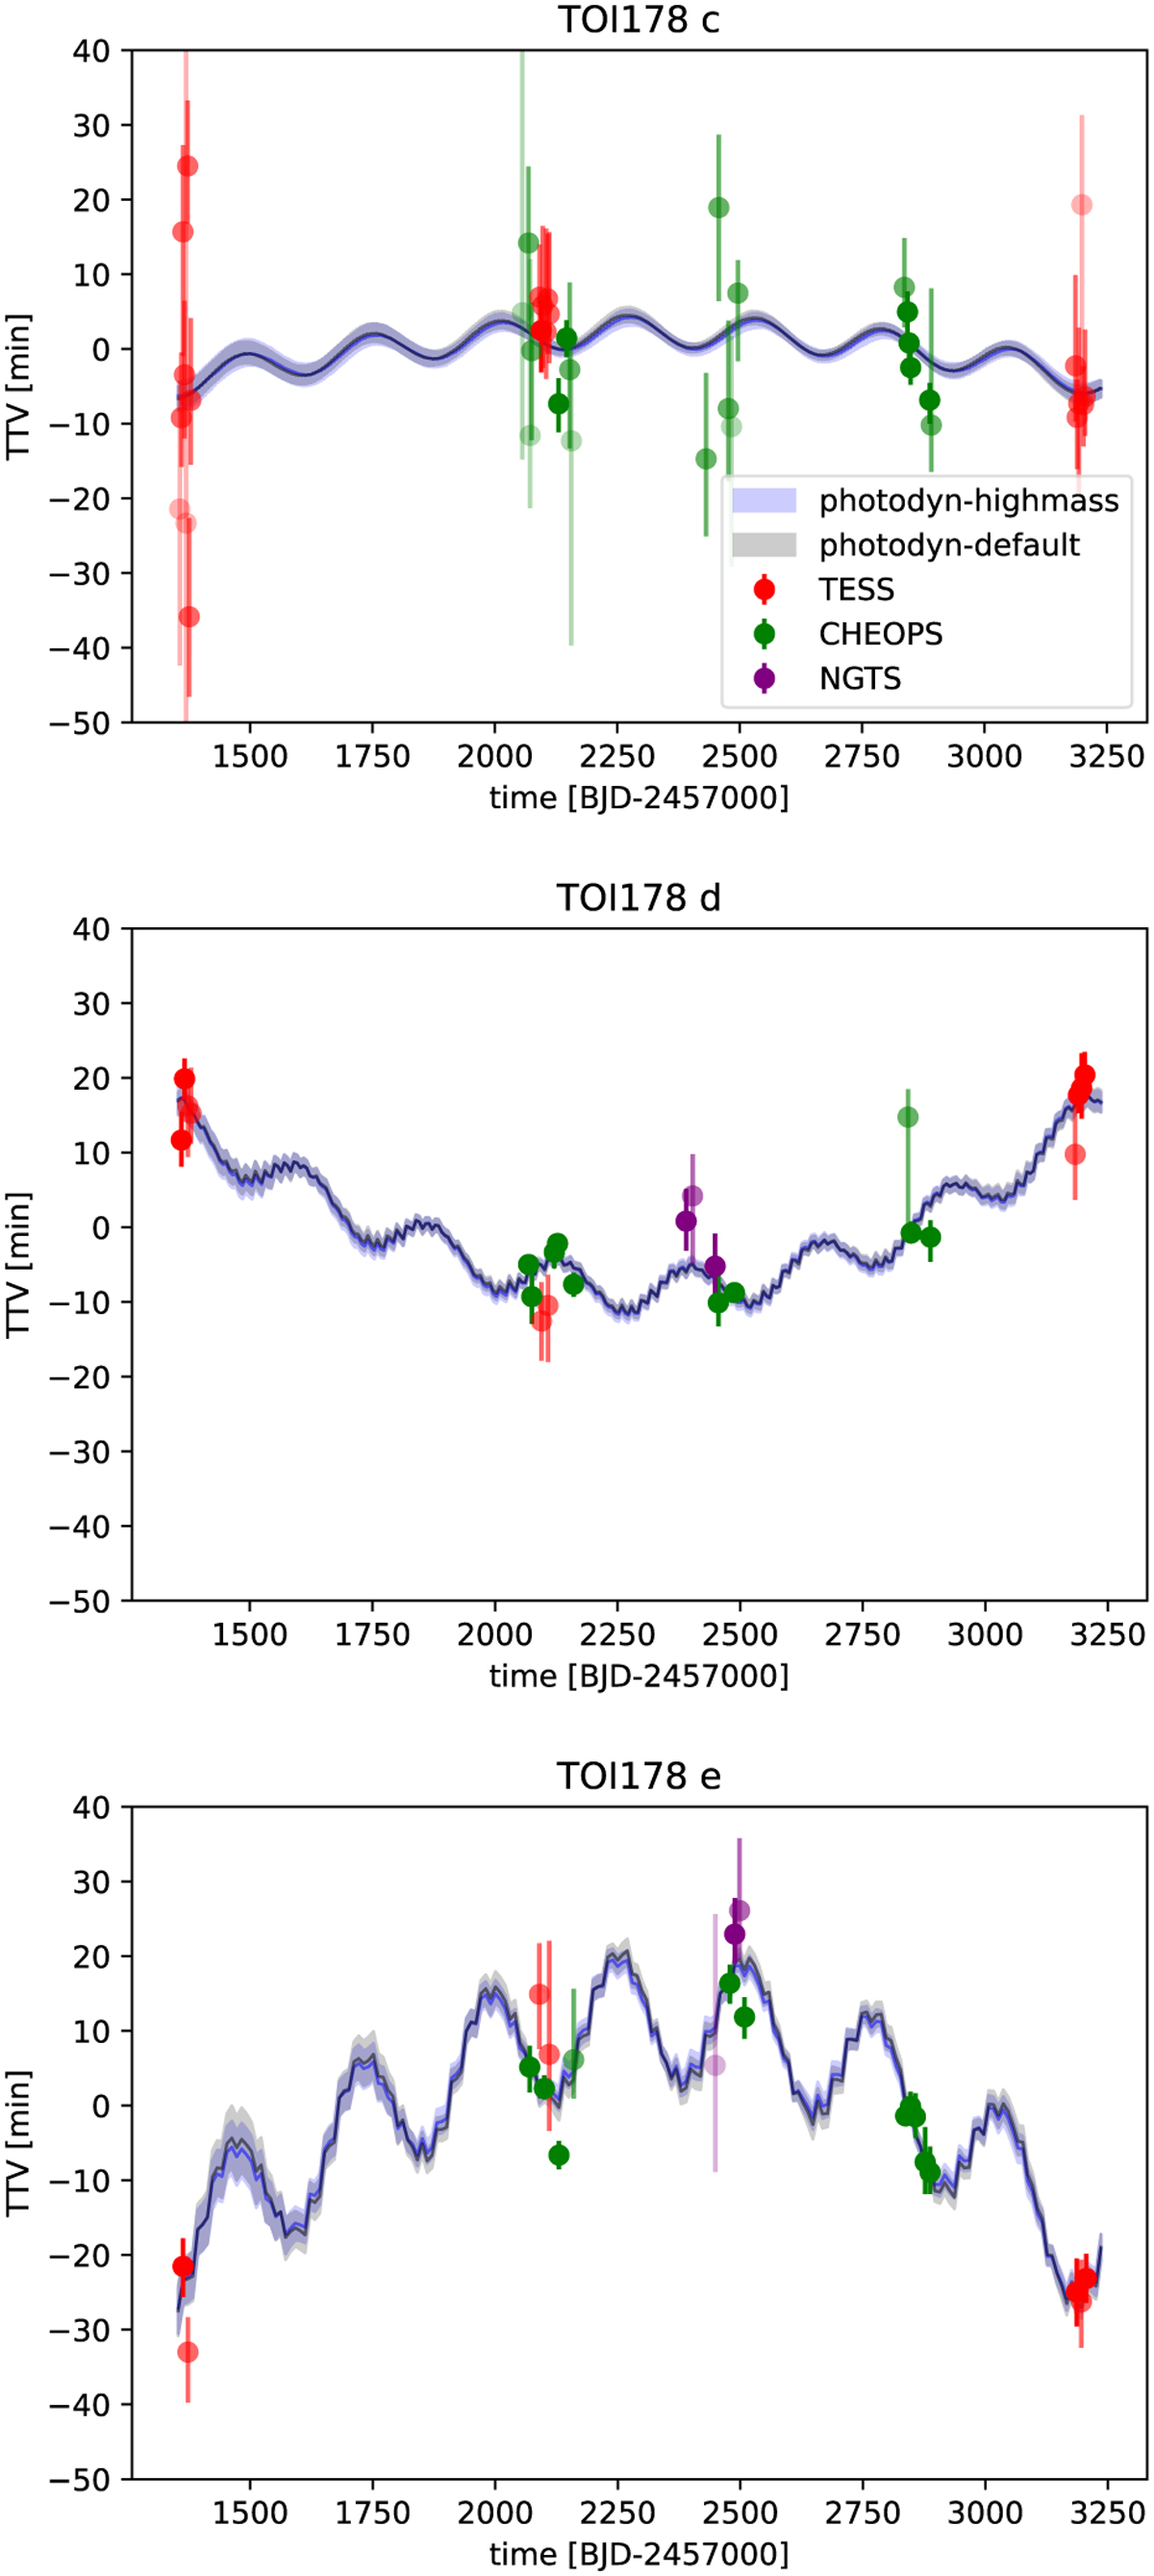
Transit timing variations observed for TOI-178 c, d and e. The filled area correspond to the 1σ posterior of the photo-dynamical fits presented in Sect. 3.2. The error bars show an estimation of the 1σ interval for the mid-transit timing of individual transits for each instrument, with transparency depending on the precision of the timings. See the text for more details.
Current usage metrics show cumulative count of Article Views (full-text article views including HTML views, PDF and ePub downloads, according to the available data) and Abstracts Views on Vision4Press platform.
Data correspond to usage on the plateform after 2015. The current usage metrics is available 48-96 hours after online publication and is updated daily on week days.
Initial download of the metrics may take a while.