Fig. 1
Download original image
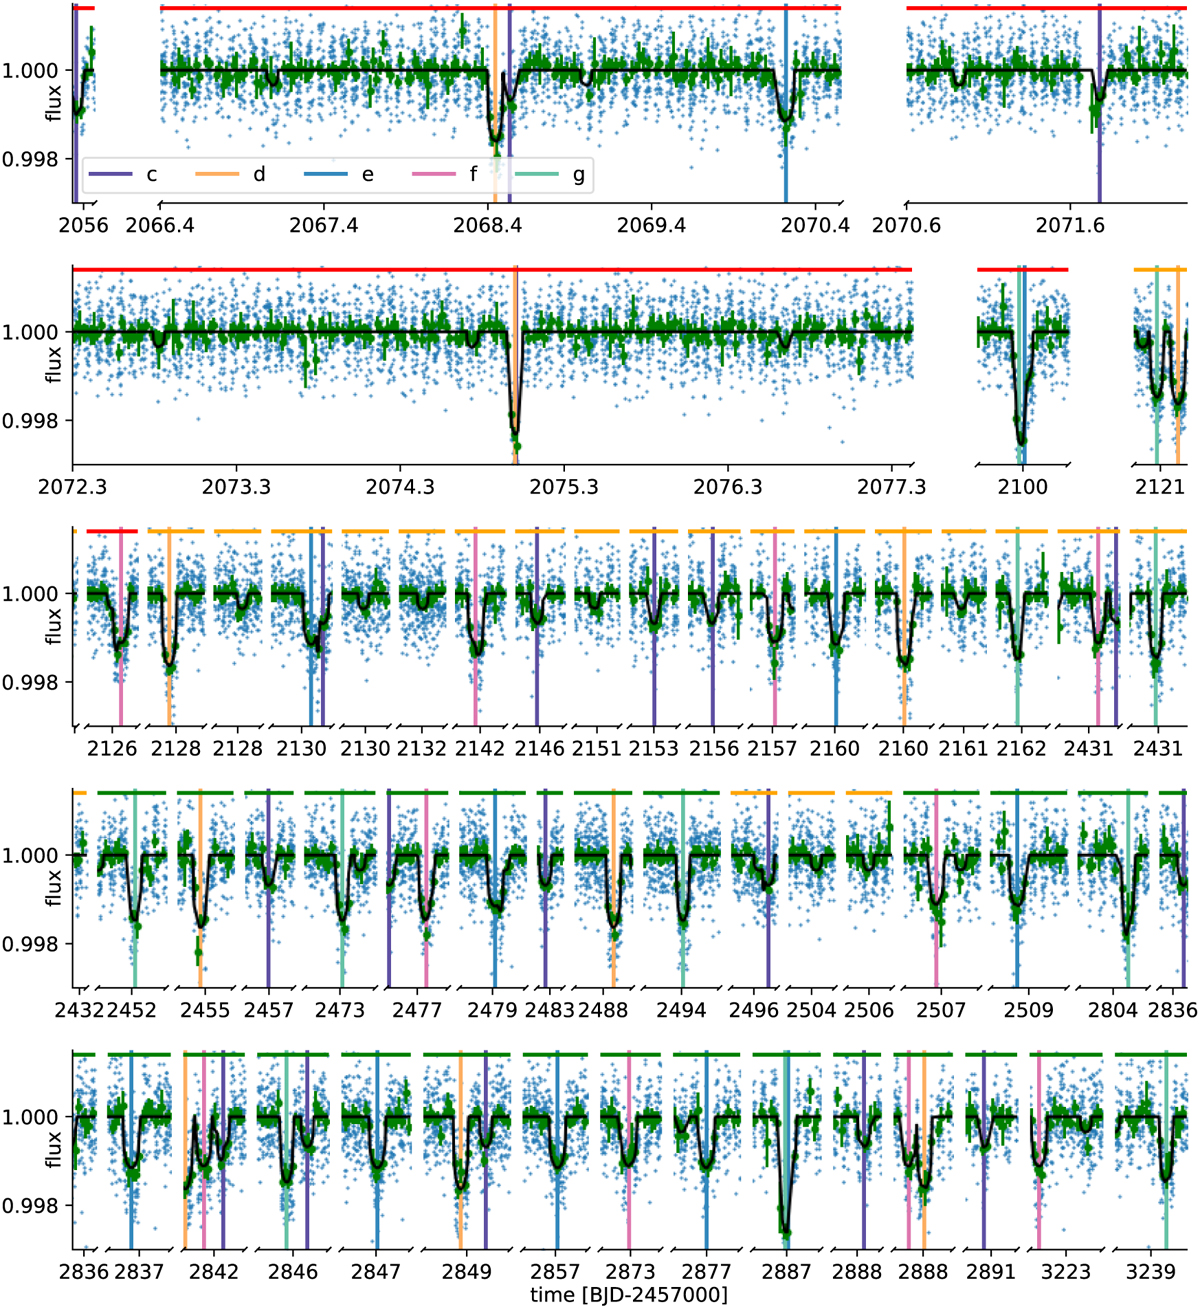
Detrended light curves from CHEOPS as described in Sects. 2.1 and 3.3 The unbinned data are shown as blue points and the data from the 30 min bins are shown as green circles. The best fitting transit model for the system is shown in black; the associated parameter values are from the final posterior shown in Tables 2 and 3. Vertical lines indicate the planet that is transiting, unflagged transits are caused by planet b. Each line contains about six days of observation. Data published in L21 are indicated by a red upper line, the one published in D23 by an orange upper line, and new data by a green upper line. The raw and detrended data are available at the CDS.
Current usage metrics show cumulative count of Article Views (full-text article views including HTML views, PDF and ePub downloads, according to the available data) and Abstracts Views on Vision4Press platform.
Data correspond to usage on the plateform after 2015. The current usage metrics is available 48-96 hours after online publication and is updated daily on week days.
Initial download of the metrics may take a while.