Fig. 7.
Download original image
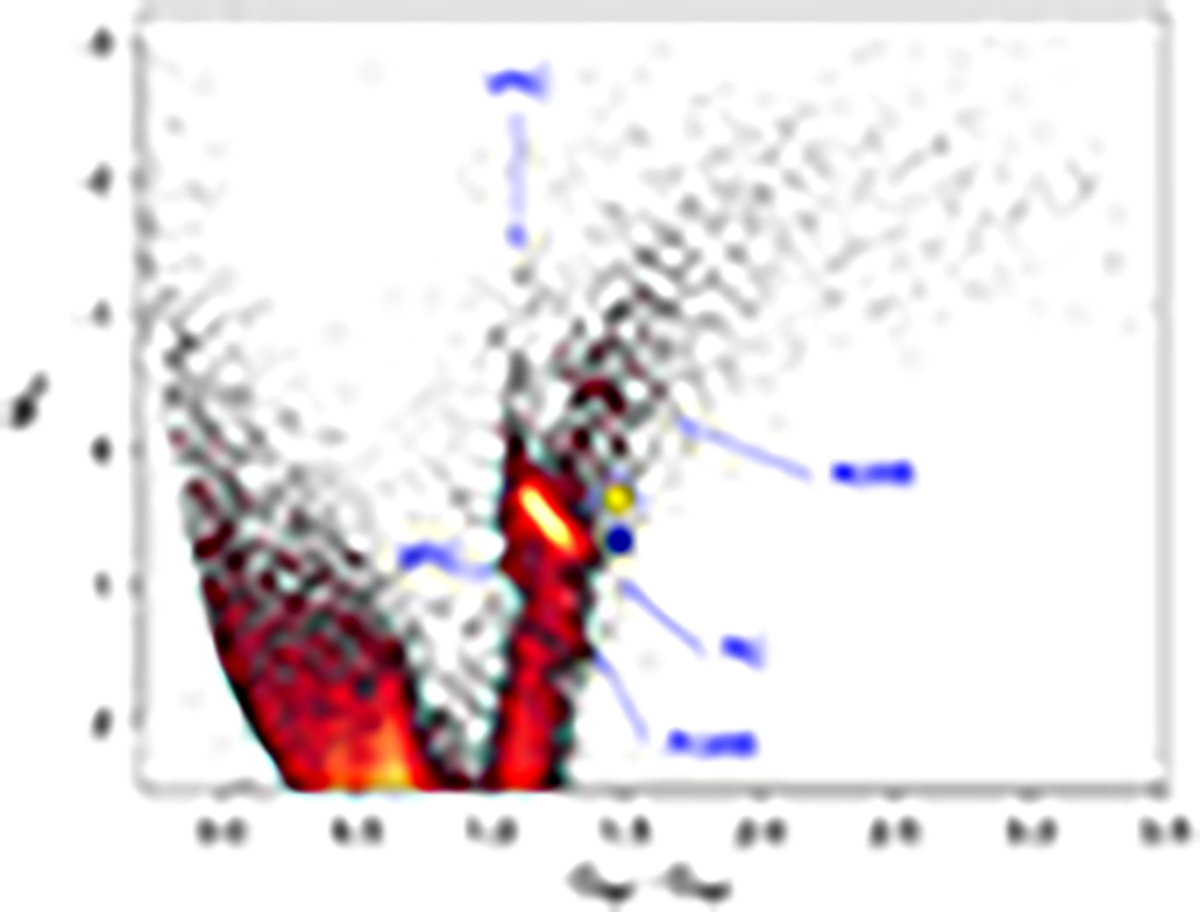
Position of the star in the HR diagram. MG is calculated using the minimum luminosity and assuming EB − V = 0.6 for the Gaia rgeo (blue) and rpgeo (yellow) distances. The points are superimposed on the Gaia data for low-extinction nearby giants (Fig. 10 in Gaia Collaboration 2018) and lie close to the Red Clump, and well within the distribution of a larger sample of stars (see e.g. Fig. 5 in the same paper).
Current usage metrics show cumulative count of Article Views (full-text article views including HTML views, PDF and ePub downloads, according to the available data) and Abstracts Views on Vision4Press platform.
Data correspond to usage on the plateform after 2015. The current usage metrics is available 48-96 hours after online publication and is updated daily on week days.
Initial download of the metrics may take a while.