Fig. 2
Download original image
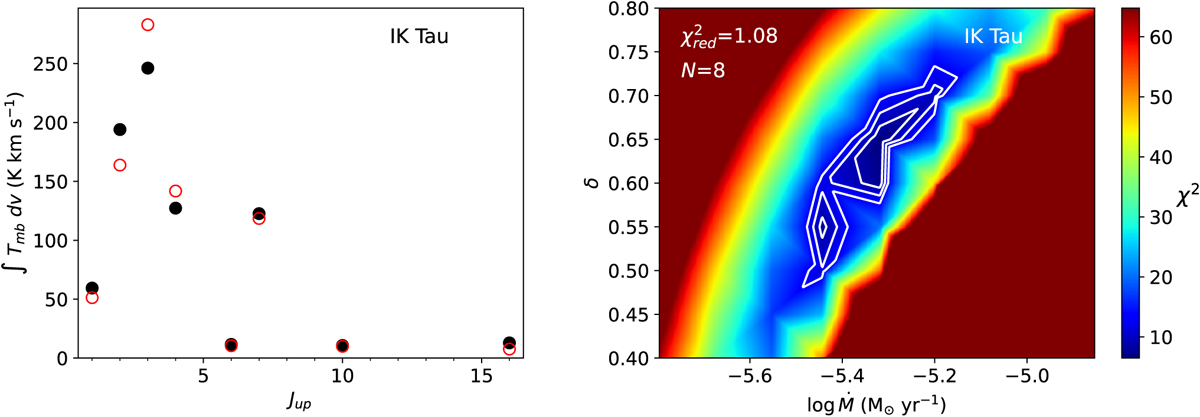
Results from CO analysis for IK Tau. The left panel shows the observed intensities (see Table A.3) as black filled circles and the calculated ones as red empty circles. The right panel shows χ2 as a function of the logarithm of the mass-loss rate, log Ṁ, and the exponent of the gas kinetic temperature radial profile, δ. The white contours correspond to 1, 2, and 3σ levels. Similar plots for other stars are shown in Fig. A.3.
Current usage metrics show cumulative count of Article Views (full-text article views including HTML views, PDF and ePub downloads, according to the available data) and Abstracts Views on Vision4Press platform.
Data correspond to usage on the plateform after 2015. The current usage metrics is available 48-96 hours after online publication and is updated daily on week days.
Initial download of the metrics may take a while.