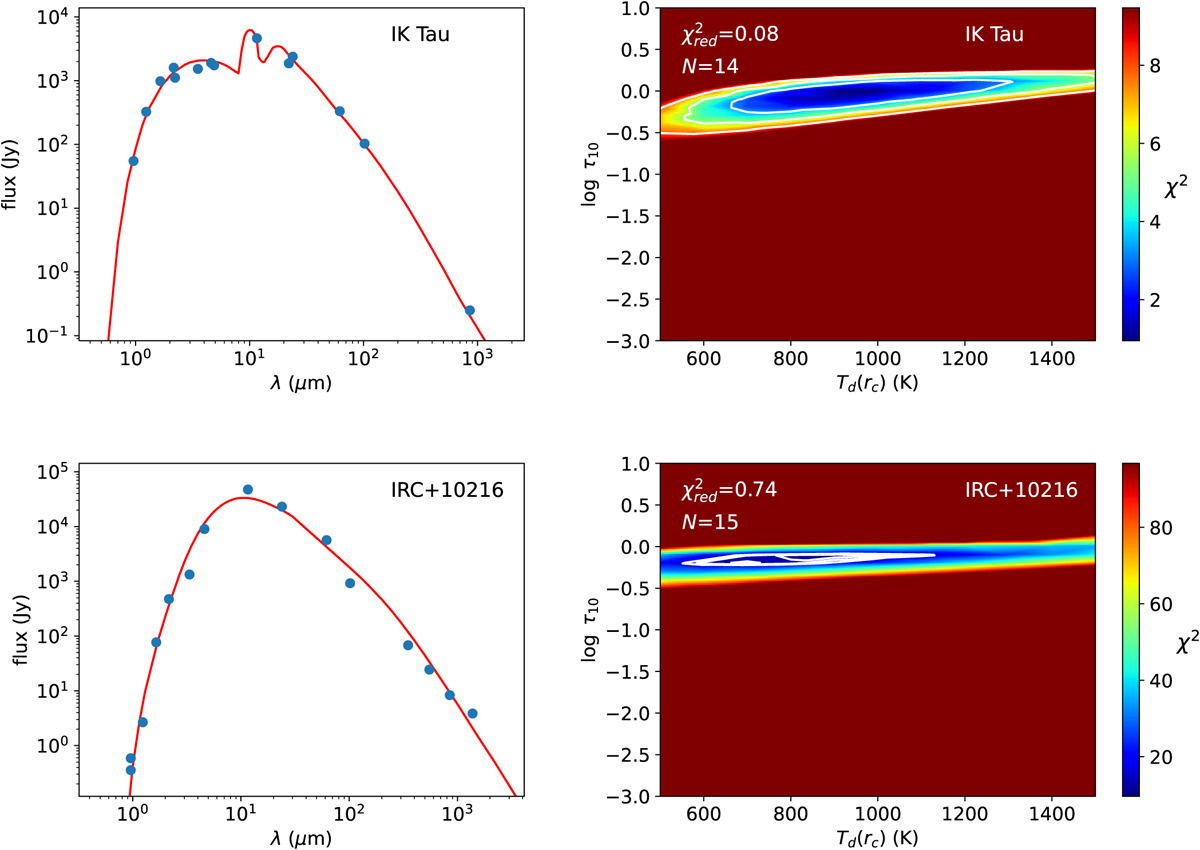
Fig. 1
Download original image
Results from SED analysis for IK Tau and IRC +10216. The left panels show the observed fluxes in blue (see Table A.2) and the calculated SED from the best DUSTY model in red. The right panels show χ2 as a function of the dust temperature at the condensation radius, Td(rc), and the logarithm of the dust optical depth at 10 µm, log τ10. The white contours correspond to 1, 2, and 3σ levels. Similar plots for other stars are shown in Fig. A.2.
Current usage metrics show cumulative count of Article Views (full-text article views including HTML views, PDF and ePub downloads, according to the available data) and Abstracts Views on Vision4Press platform.
Data correspond to usage on the plateform after 2015. The current usage metrics is available 48-96 hours after online publication and is updated daily on week days.
Initial download of the metrics may take a while.