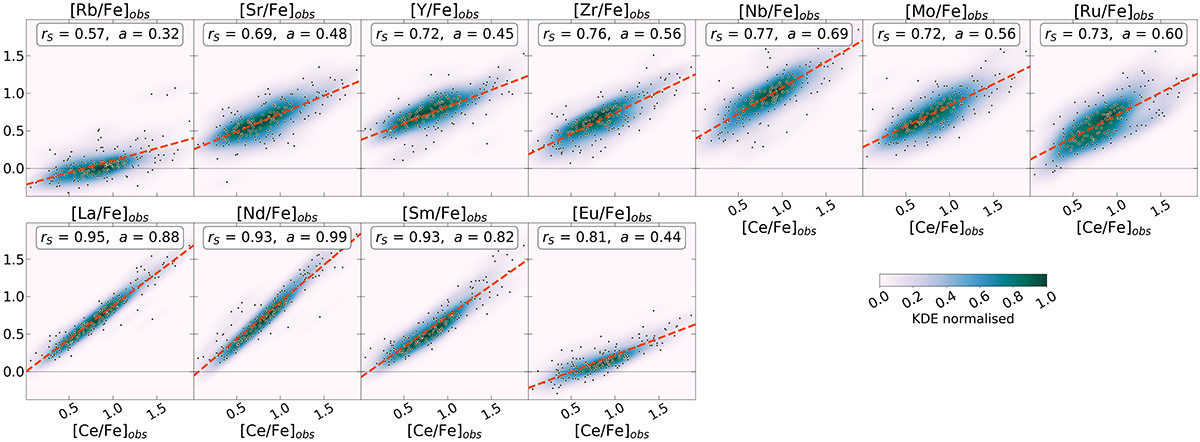
Fig. 7.
Download original image
Observed elemental abundances [A/Fe] as a function of the observed [Ce/Fe]. The colouring corresponds to the 2D KDE of the 180 points shown. The linear fit was performed with ODR. Note that if we refer to [A/Fe] vs [B/Fe], but plot [B/Fe] vs [A/Fe], the sign of the relationship (correlation or anti-correlation) remains the same. In fact, the swap of the two axes results in a reflection around a diagonal line with a slope of 1. The resulting slope is therefore 1/a, while rS is the same in both cases.
Current usage metrics show cumulative count of Article Views (full-text article views including HTML views, PDF and ePub downloads, according to the available data) and Abstracts Views on Vision4Press platform.
Data correspond to usage on the plateform after 2015. The current usage metrics is available 48-96 hours after online publication and is updated daily on week days.
Initial download of the metrics may take a while.