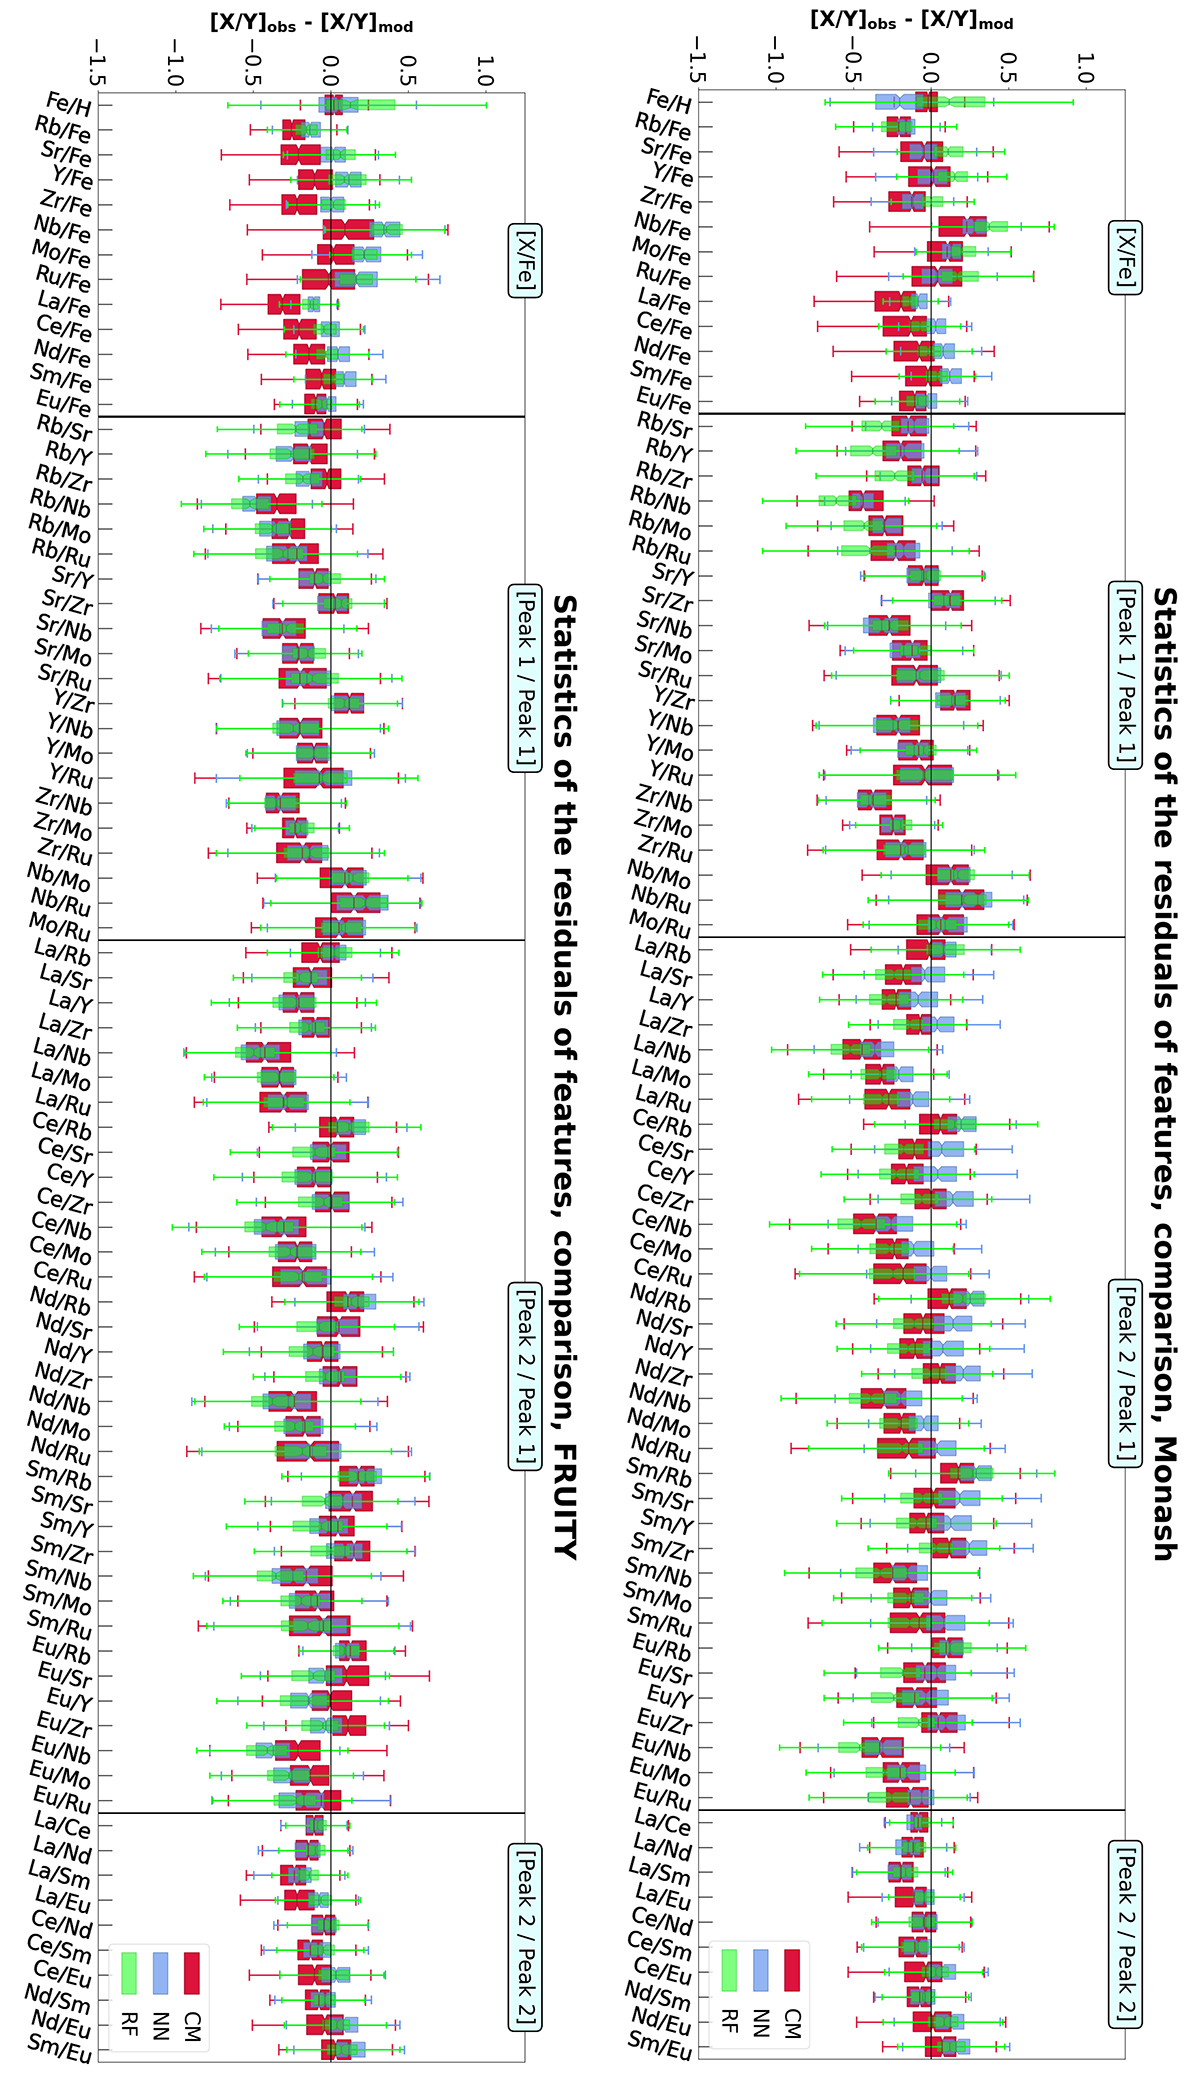
Fig. B.3.
Download original image
Boxplots for the different classifiers plotted over each other. CM is indicated with red and the widest boxes, NN is the blue and middle-sized boxes, while the RF results are the green and thinnest. The top figure contains the results for the all three classifiers applied to Monash models, while the bottom figure shows the same for FRUITY models.
Current usage metrics show cumulative count of Article Views (full-text article views including HTML views, PDF and ePub downloads, according to the available data) and Abstracts Views on Vision4Press platform.
Data correspond to usage on the plateform after 2015. The current usage metrics is available 48-96 hours after online publication and is updated daily on week days.
Initial download of the metrics may take a while.