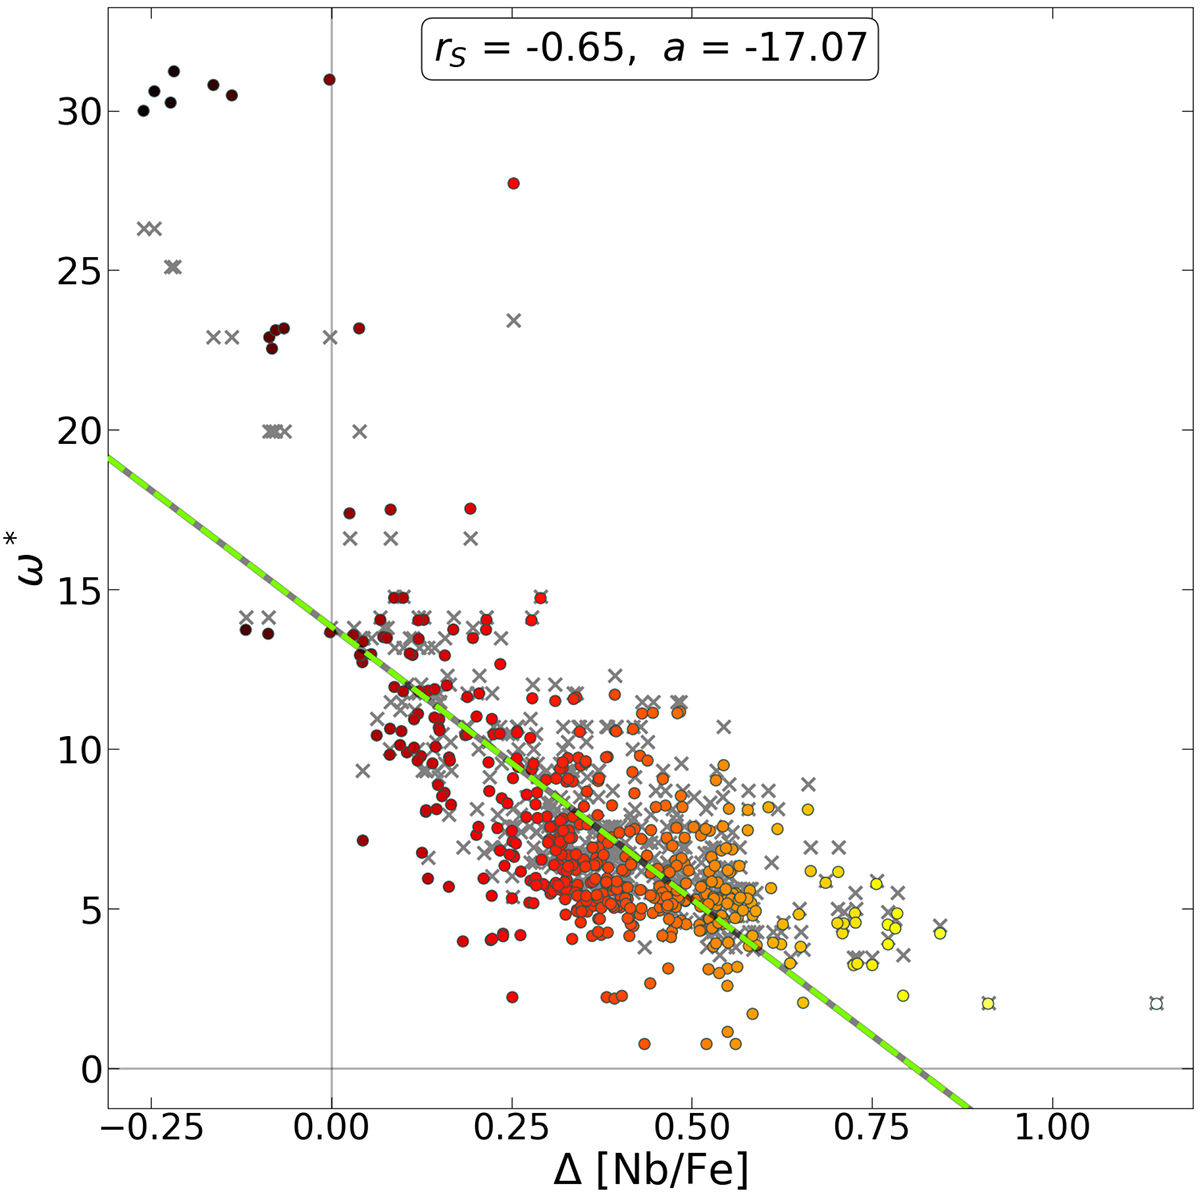
Fig. 16.
Download original image
Values of ω* for each Ba star as a function of the residuals Δ [Nb/Fe]. The grey crosses represent the points calculated from the Ba star abundances. The coloured points correspond to the data recalculated to the AGB values, colour-coded to the value of the residual, with the same scale is in Fig. 15. The fitted line is to the AGB values, the rS coefficient and the slope a of the fitted line to this relation are shown above. The same fit for the Ba star abundances gives rS = −0.74 and a = −15.38.
Current usage metrics show cumulative count of Article Views (full-text article views including HTML views, PDF and ePub downloads, according to the available data) and Abstracts Views on Vision4Press platform.
Data correspond to usage on the plateform after 2015. The current usage metrics is available 48-96 hours after online publication and is updated daily on week days.
Initial download of the metrics may take a while.