Fig. 15.
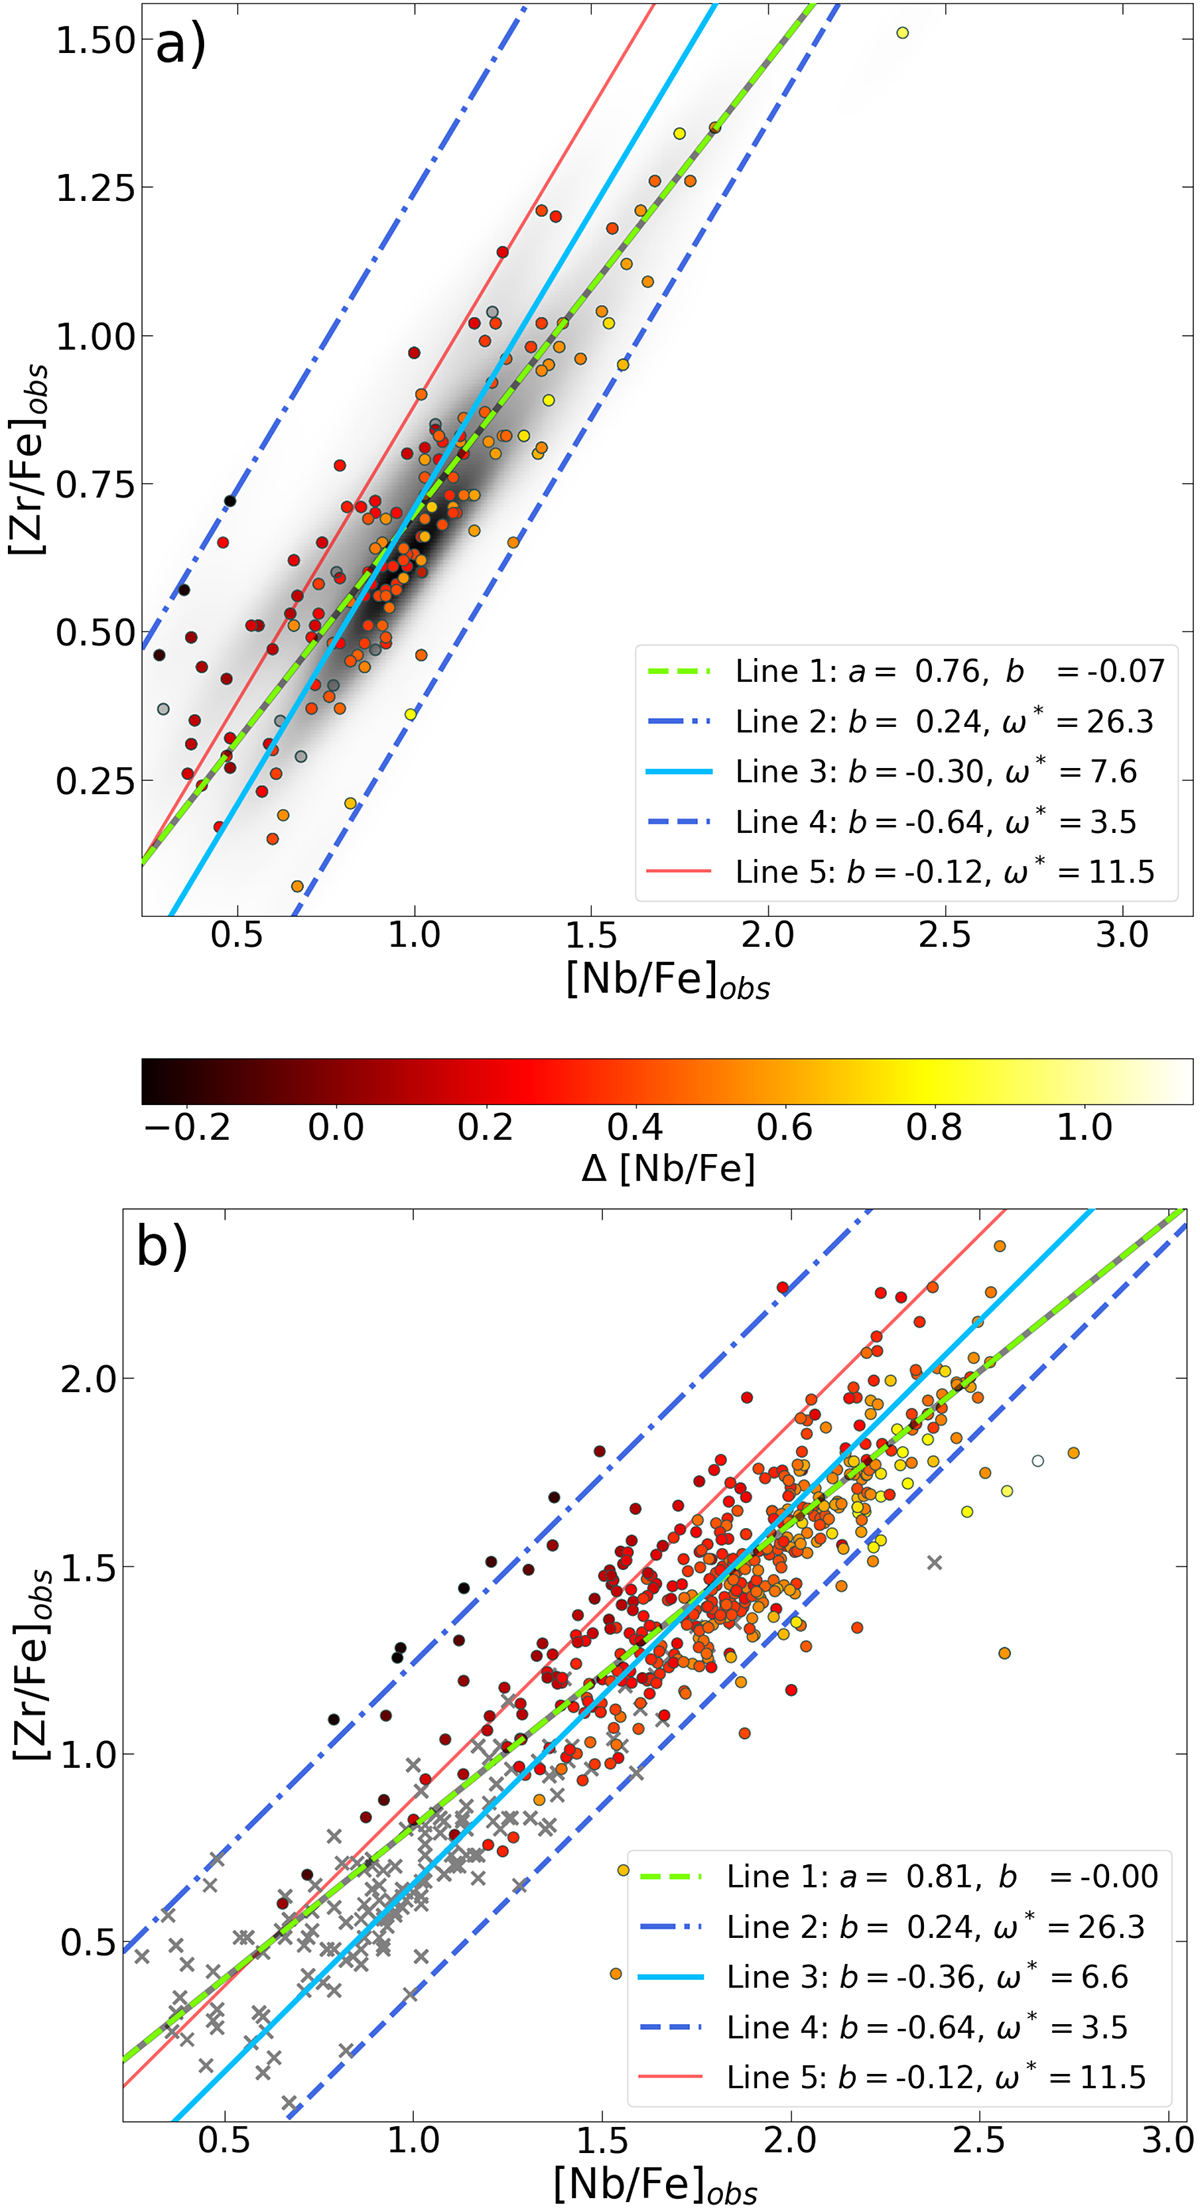
Download original image
Abundances [Zr/Fe] as a function of [Nb/Fe] and the corresponding linear fits. a) [Zr/Fe] abundances as a function of [Nb/Fe] for our sample of Ba stars. (The figure includes 162 points, because for 18 stars Nb abundances are not available.) The points are colour-coded to show the residual Δ [Nb/Fe] for each star, averaged over all its classified models (the 9 stars with grey, semi-transparent points have no residual, as no models were classified for these stars). Line 1 is a fit to the data, with the slope a as a free parameter; Line 3 is an isothermal line (with slope fixed to 1) fitted to the data; Lines 2 and 4 are isothermal lines passing through the stars with the (second) lowest and highest b intercept, respectively; Line 5 is the isothermal corresponding to ω* = 10.5, the lowest value achievable for AGB temperatures (at most 450 MK) based on Fig. 14. The greyscale colouring in the background represents the 2D KDE of the points. b) Same as panel a), but including the 533 calculated AGB star abundances (there is more than one δ for each Ba star) from Eq. (4). The original Ba star abundances are marked with grey crosses, while the AGB abundances are coloured on the same scale as in panel a). The lines have the same meaning as in panel a), but fitted to the AGB star abundances.
Current usage metrics show cumulative count of Article Views (full-text article views including HTML views, PDF and ePub downloads, according to the available data) and Abstracts Views on Vision4Press platform.
Data correspond to usage on the plateform after 2015. The current usage metrics is available 48-96 hours after online publication and is updated daily on week days.
Initial download of the metrics may take a while.