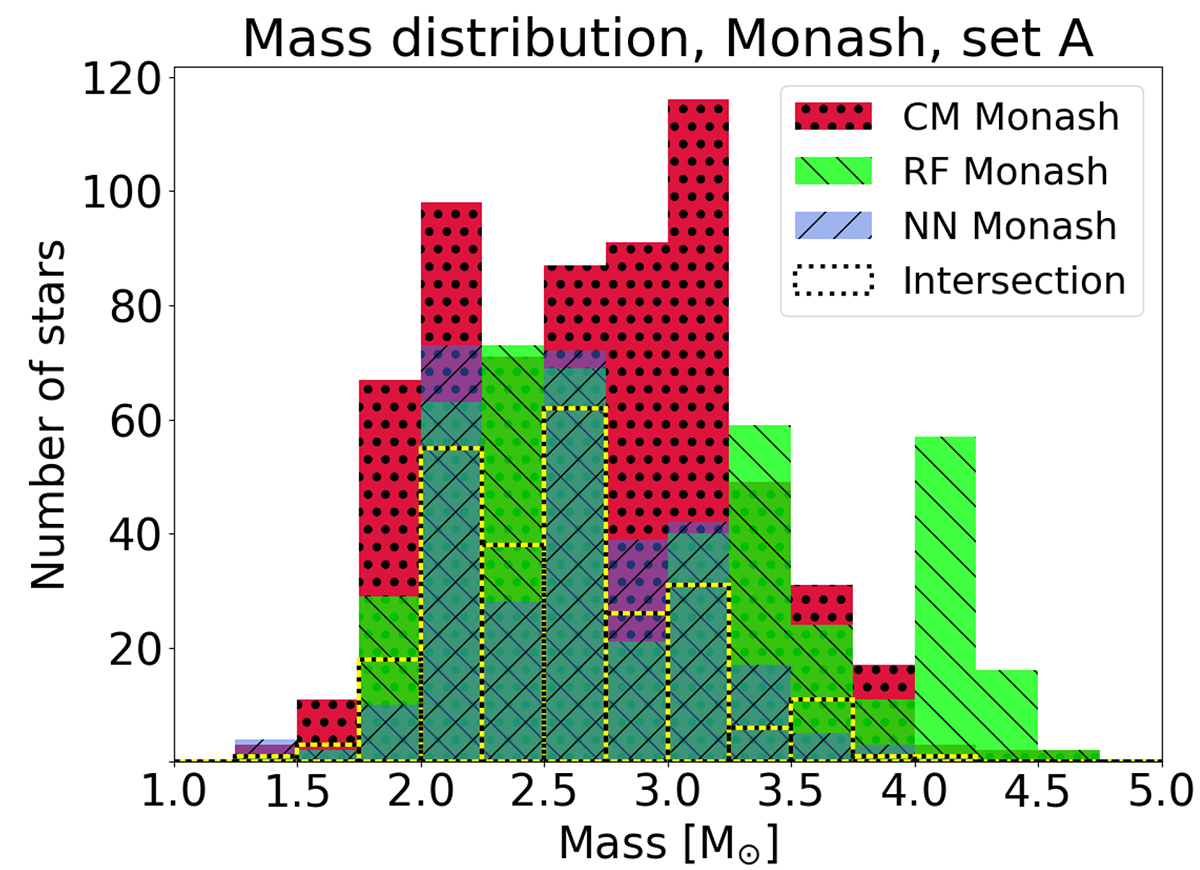
Fig. 11.
Download original image
Mass distribution histogram of the polluting AGB stars based on Monash models. Here we used element set A (all elements except Nb). Each star is counted in bins in the range of the classified minimum and maximum masses. Different colours indicate the models of different classifiers. The bin width is 0.25 M⊙. The dashed line labelled ‘Intersection’ shows the histogram for stars classified in the same bin by at least two of the classifiers.
Current usage metrics show cumulative count of Article Views (full-text article views including HTML views, PDF and ePub downloads, according to the available data) and Abstracts Views on Vision4Press platform.
Data correspond to usage on the plateform after 2015. The current usage metrics is available 48-96 hours after online publication and is updated daily on week days.
Initial download of the metrics may take a while.