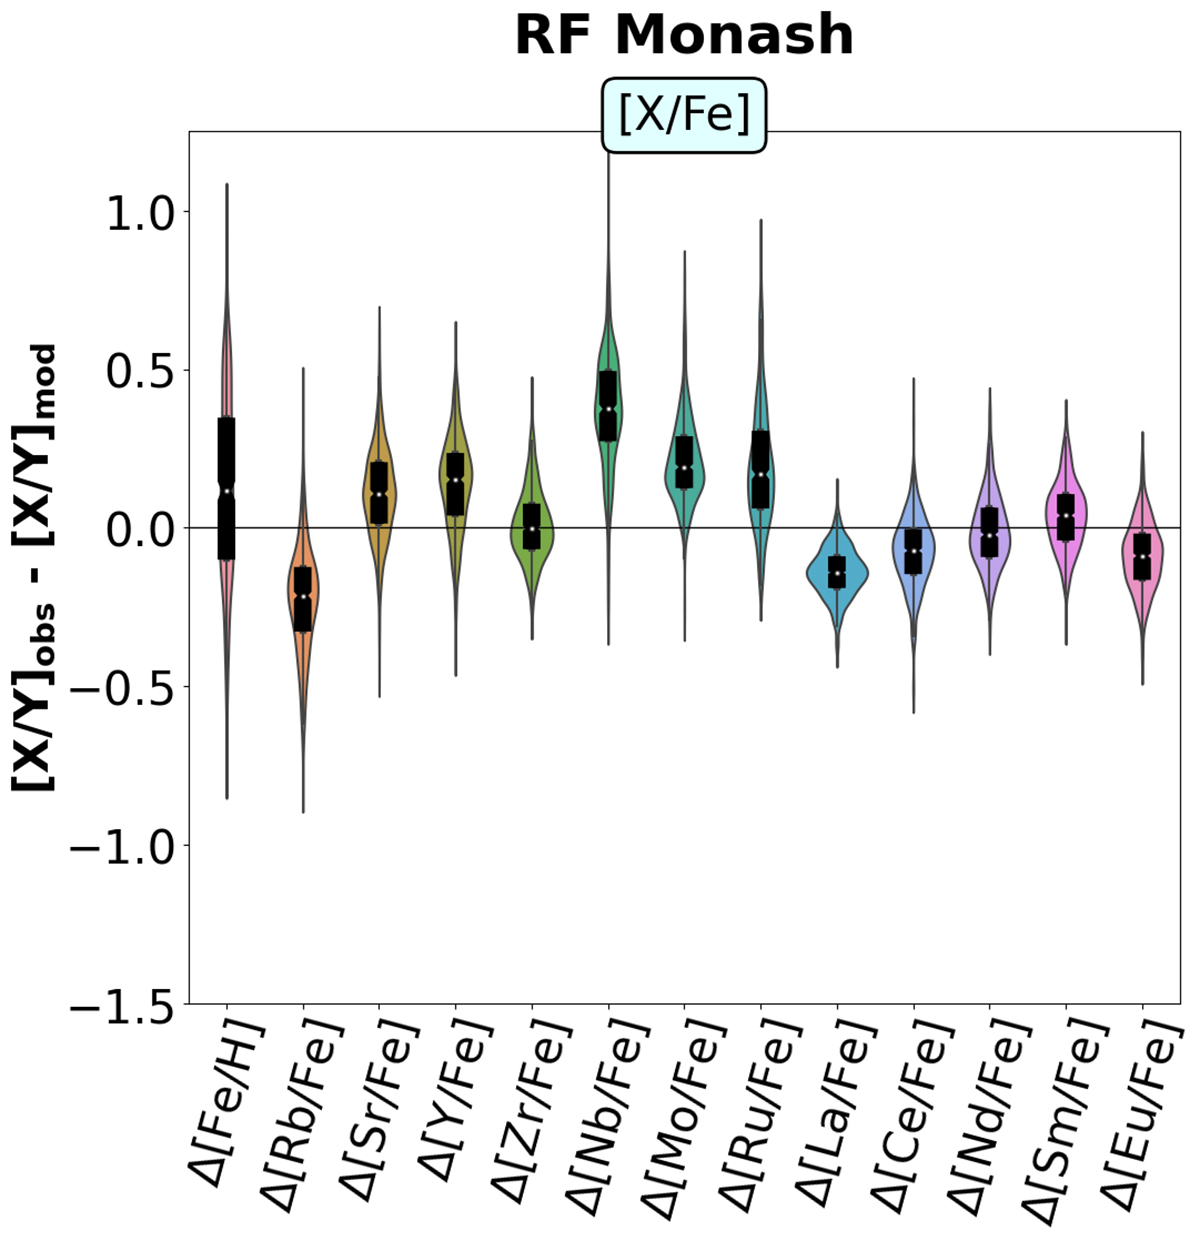
Fig. 1.
Download original image
Violin plots of the residuals of the metallicity and the elemental abundances. The residuals are shown for the RF classifier of Monash models, ordered by increasing atomic number. The black boxes above the violins show the interquartile region (IQR) of the residual distribution (i.e. the region where half of the data points lie around the median). Its notch and the corresponding white marker indicate the position of the median.
Current usage metrics show cumulative count of Article Views (full-text article views including HTML views, PDF and ePub downloads, according to the available data) and Abstracts Views on Vision4Press platform.
Data correspond to usage on the plateform after 2015. The current usage metrics is available 48-96 hours after online publication and is updated daily on week days.
Initial download of the metrics may take a while.