Fig. 11
Download original image
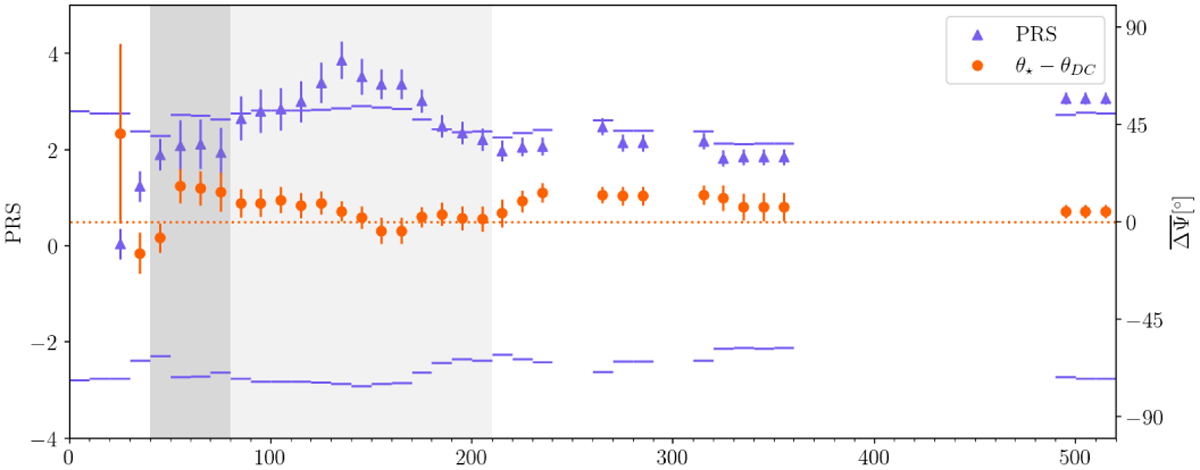
PRS values (purple triangles), their errors and the significance threshold (horizontal bars) computed between starlight polarisation and depolarisation canals in the region east from RA 23h15m. Orange marks represent Δψ and the associated error. The result for each bin is represented by a point at its lower border. The lighter shaded area represents all bins in which we find alignment, while the darker shaded area marks the estimated range for the minimum distance to the structures.
Current usage metrics show cumulative count of Article Views (full-text article views including HTML views, PDF and ePub downloads, according to the available data) and Abstracts Views on Vision4Press platform.
Data correspond to usage on the plateform after 2015. The current usage metrics is available 48-96 hours after online publication and is updated daily on week days.
Initial download of the metrics may take a while.