Fig. 10
Download original image
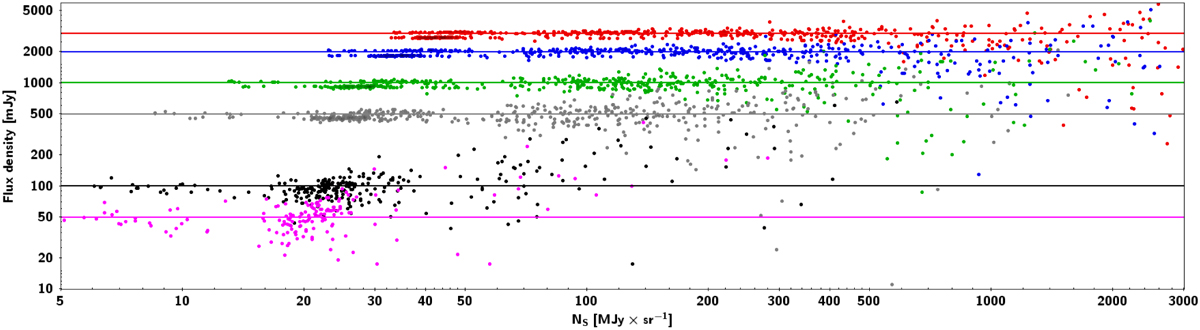
Measured flux density as a function of NS in the Scan Map R observations for sources injected at the 3000 (red), 2000 (blue), 1000 (green), 500 (grey), 100 (black) and 50 (magenta) mJy level. At higher NS values, the flux density values show higher scatter at all flux density levels. The solid lines indicate the respective theoretical flux density values.
Current usage metrics show cumulative count of Article Views (full-text article views including HTML views, PDF and ePub downloads, according to the available data) and Abstracts Views on Vision4Press platform.
Data correspond to usage on the plateform after 2015. The current usage metrics is available 48-96 hours after online publication and is updated daily on week days.
Initial download of the metrics may take a while.