Fig. 1
Download original image
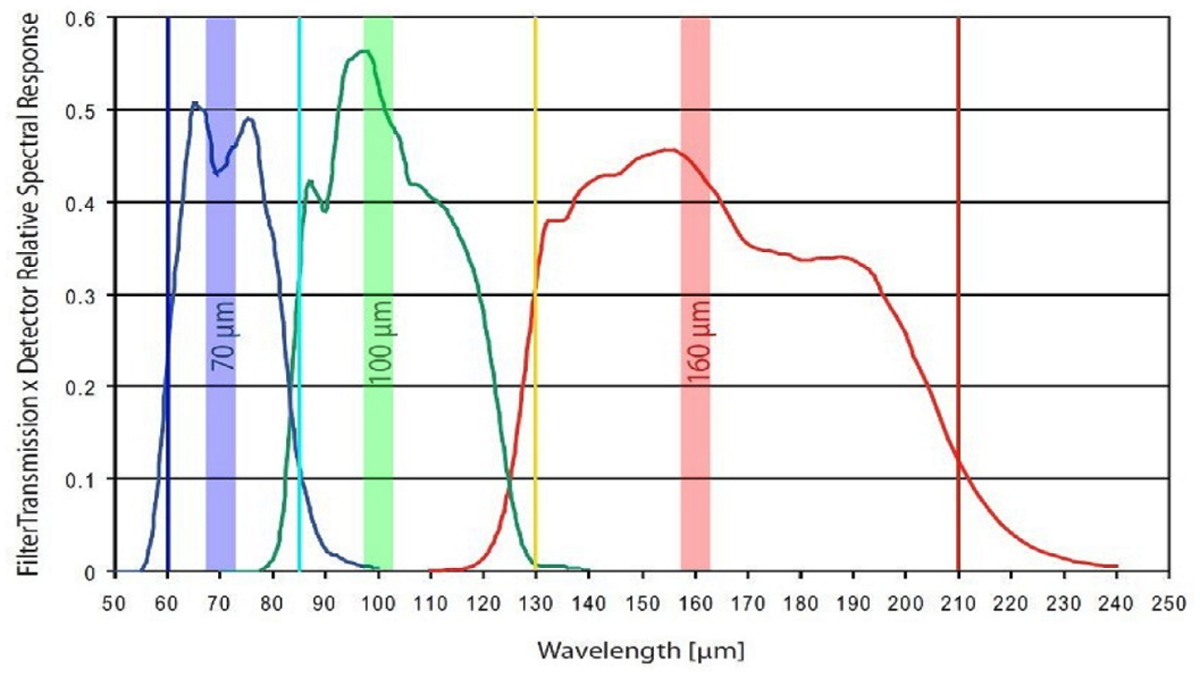
Filter transmissions of the PACS filter chains. The graph is from the PACS Observer’s Manual and represents the overall transmission of the combined filters with the dichroic and the detector relative response in each of the three bands of the photometer. The dashed vertical lines mark the original intended (design values) of the band edges.
Current usage metrics show cumulative count of Article Views (full-text article views including HTML views, PDF and ePub downloads, according to the available data) and Abstracts Views on Vision4Press platform.
Data correspond to usage on the plateform after 2015. The current usage metrics is available 48-96 hours after online publication and is updated daily on week days.
Initial download of the metrics may take a while.